
Page 184 - 2021_10-Haematologica-web
P. 184
S. El Hoss et al.
flow cytometry. Differentiating erythroblasts were deter- mined using the CD49d and Band 3 staining pattern within the GPA+ population (Figure 5A), as previously described.14 Imaging flow cytometry was used to confirm gating of all nucleated cells and cell homogeneity within each of the four gated populations by cellular features of size, mor- phology and nuclear size and polarization (Figure 5B). We quantified the cells at the early basophilic (EB), late basophilic (LB), polychromatic and orthochromatic stages. Considering the GPA positive population as 100%, the mean percentages of EB, LB, polychromatic and orthochro- matic cells were 5.1%, 10.2%, 20.4% and 25.2% (Figure 5C), indicating loss of the expected cell doubling between the polychromatic and orthochromatic stages (1.24+/-0.1, P<0.01; Figure 5D). These results implied that cell death occurs between the polychromatic and orthochromatic stages in a significant proportion of erythroblasts, in accor- dance with our in vitro data. Similar analysis was performed with bone marrow aspirates of five controls (3% EB, 6.8% LB, 13% polychromatic cells and 24.6% orthochromatic cells, Figure 5C) that confirmed the expected doubling of cells with successive cell divisions without cell loss between development stages during normal erythropoiesis (Figure 5D). Next, we stained the cells with an anti-HbF antibody to measure the percentage of F-cells at the differ- ent stages. There was a significant increase in %F-cells between the polychromatic (16.4%±4) and orthochromat- ic stages (32.4%±4.79) (Figure 5E and F), concomitant with the cell loss observed between these stages (Figure 5C and
D), indicating preferential survival of F-cells during late stages of erythroblast maturation in vivo and supporting our hypothesis for an anti-apoptotic role of HbF during in vivo erythropoiesis in SCD.
Induction of fetal hemoglobin protects against cell death
In order to confirm the anti-apoptotic role of HbF in SCD erythroblasts we induced its expression in vitro using poma- lidomide (POM), an immunomodulatory drug previously shown to induce HbF expression during erythropoiesis,11,26 and determined if higher HbF levels could rescue the cells from apoptosis. As we were interested in monitoring the stages during which hemoglobin is synthesized, POM was added at D1 of phase II of culture. As expected, POM- treated SCD cultures showed higher percentages of F-cells than untreated cultures (Figure 6A; Online Supplementary Figure S4A). HbF induction by POM was associated with significantly lower levels of apoptosis compared to untreated cultures under both hypoxia and normoxia (Figure 6B; Online Supplementary Figure S4B). Importantly, there was no significant difference in the apoptosis levels between normoxic and hypoxic conditions of POM-treat- ed cells indicating that the higher F-cell levels protected SCD cells from apoptosis under hypoxia.
In order to specifically address the role of HbF, we used a CRISPR-Cas9 approach that we have recently developed to mimic the effect of hereditary persistence of fetal hemo- globin (HPFH) by disrupting the binding site for HbF
AB
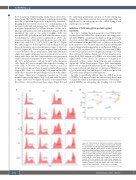
Figure 2. Distribution of erythroid precursors expressing fetal hemoglobin in vitro. (A) Flow cytometry plots showing the percentage of cells expressing fetal hemoglobin (F-cells) at day (D) 3, D5, D7, D9 and D11 of phase II of culture in control erythroid precursors under normoxia (CN) or hypoxia (CH), and in patient erythroid precursors under normoxia (PN) or hypoxia (PH). (B) Flow cytometry plots showing dead cells, measured by fixable viability stain (FVS APC-Cy7), in non-F-cells (F-) (blue curve) and F-cells (F+) (red curve) of control (CH) and patient (PH) cells under hypoxia. (C) Percentage of F-cells measured at D7 and D9 of phase II of culture in control (n=4) and patient cells (n=6) under nor- moxia (N) and hypoxia (H). (continued on next page).
2712
haematologica | 2021; 106(10)
