
Page 175 - 2021_10-Haematologica-web
P. 175
Carfilzomib or bortezomib in first relapse MM
S4A, Table 2B). This difference between risk groups was not seen for the ORR, with there being more responses to KCd than to VCd in both adverse- and standard-risk par- ticipants, (79.4% vs. 68.8%, and 87.3% vs. 70.4%). Of par- ticipants with an adverse IgH translocation, only one of seven (14.3%) in the VCd arm achieved a VGPR, com- pared to seven of 11 (63.6%) in the KCd arm (Online Supplementary Figure S4B). There was no significant differ- ence in MRD-negative rates (Table 2B) or PFS between the KCd and VCd arms in either adverse- or standard-risk patients.
With regard to the maintenance randomization, genetic risk status was available overall for 94 participants (67%) (Table 3), with 48.4% adverse-risk patients in the mainte- nance arm, and 55.1% in the observation arm. Of those completing treatment, the standard-risk patients received a median of nine cycles (range, 0-19), compared with five cycles (range, 1-18) for the adverse-risk patients. While 11 of 23 (47.8%) standard-risk patients received >12 months
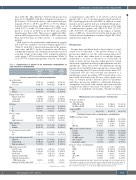
Table 3. Characteristics of patients in the maintenance randomization: at study entry and at randomization.
of maintenance, only three of 17 (17.6%) adverse-risk patients did so. In a Cox proportional hazards model for PFS, including genetic risk and MRD, in addition to mini- mization factors, genetic risk was independently prognos- tic, alongside treatment and disease response at the time of randomization (genetic risk: HR=1.91, 80% CI: 1.27, 2.59; P=0.0333). No difference in the impact of mainte- nance on PFS was observed between the risk groups: both benefited from maintenance treatment (Figure 5B, Online Supplementary Figure S5).
Discussion
Despite three published head-to-head studies of carfil- zomib versus bortezomib,4,9-11 the relative benefits of one proteasome inhibitor over the other remain unresolved. Here we show that, when used as second-line therapy, carfilzomib is at least as efficacious as bortezomib, in terms of major disease response, when given for a fixed duration in combination with cyclophosphamide and dex- amethasone. There were fewer discontinuations among patients treated with KCd than among those treated with VCd, indicating that KCd was tolerated better than VCd. Carfilzomib was also well tolerated and effective as a maintenance agent, providing a PFS benefit when com- pared with observation only. No new safety signals were seen, as toxicity profiles reflected previous experience with these proteasome inhibitors, carfilzomib being pre- dominantly associated with anemia and cardiovascular complications while bortezomib was linked to a higher incidence of peripheral neuropathy, thrombocytopenia
continued from previous coloumn
Sex
Maintenance Nomaintenance (N=69) (N=72)
Total (N=141)
n(%) n(%) n(%)
Baseline characteristics at initial randomization
Age at trial entry Median (range)
≥70 years Male
Female
Timing of first relapse Primary refractory <12 months
≥12 months
ISS stage I
II
III
Disease isotype IgG
IgA
Light chain only
Light chain type Kappa
Lambda
Received previous bortezomib? Yes
No
Genetic risk at trial entry (n=109) High risk
Standard risk Risk unconfirmed
High risk lesions (n=49) Del(17p) only
Gain(1q) only
t(4;14) only
Gain(1q) and del(17p) Gain(1q) and any adverse
IGH translocation
Gain(1q), del(17p) and t(4;14)
65 (35, 80) 29 (42.0%)
43 (62.3%) 26 (37.7%)
1 (1.4%) 10 (14.5%) 58 (84.1%)
39 (56.5%) 24 (34.8%) 6 (8.7%)
45 (65.2%) 18 (26.1%) 6 (8.7%)
46 (66.7%) 23 (33.3%)
19 (27.5%) 50 (72.5%)
22 (42.3%) 23 (44.2%) 7 (13.5%)
5 (22.7%) 15 (68.2%) 1 (4.5%) 0
1 (4.5%) 0
69 (48, 83) 34 (47.2%)
42 (58.3%) 30 (41.7%)
1 (1.4%) 8 (11.1%) 63 (87.5%)
42 (58.3%) 24 (33.3%) 6 (8.3%)
50 (69.4%) 14 (19.4%) 8 (11.1%)
51 (70.8%) 21 (29.2%)
13 (18.1%) 59 (81.9%)
27 (47.4%) 22 (38.6%) 8 (14.0%)
3 (11.1%) 15 (55.6%) 3 (11.1%) 3 (11.1%)
2 (7.4%) 1 (3.7%)
68 (35, 83) 63 (44.7%)
85 (60.3%) 56 (39.7%)
2 (1.4%) 18 (12.8%) 121 (85.8%)
81 (57.4%) 48 (34.0%) 12 (8.5%)
95 (67.4%) 32 (22.7%) 14 (9.9%)
97 (68.8%) 44 (31.2%)
32 (22.7%) 109 (77.3%)
49 (45.0%) 45 (41.3%) 15 (13.8%)
8 (16.3%) 30 (61.2%) 4 (8.2%) 3 (6.1%)
3 (6.1%) 1 (2.0%)
Response category at the end of therapy
VGPR, CR or sCR PR, MR or SD/NC
Previous ASCT? Yes
40 (58.0%) 29 (42.0%)
46 (66.7%)
39 (54.2%) 33 (45.8%)
48 (66.7%)
79 (56.0%) 62 (44.0%)
94 (66.7%)
Minimisation factors at maintenance randomisation
Participant characteristics at maintenance randomization
ECOG performance status 0
1
2 Missing
MRD at end of initial treatment Positive
Negative Suspicious
No MRD sample Not evaluable Inadequate sample
Response at time of randomization CR
VGPR
PR
MR
SD or NC PD
43 (62.3%) 22 (31.9%) 1 (1.4%) 3 (4.3%)
39 (56.5%) 8 (11.6%) 2 (2.9%) 13 (18.8%) 0 (0.0%) 7 (10.1%)
2 (2.9%) 30 (43.5%) 33 (47.8%) 2 (2.9%) 1 (1.4%) 1 (1.4%)
38 (52.8%) 32 (44.4%) 1 (1.4%) 1 (1.4%)
42 (58.3%) 10 (13.9%) 4 (5.6%) 11 (15.3%) 1 (1.4%) 4 (5.6%)
1 (1.4%) 29 (40.3%) 39 (54.2%) 2 (2.8%) 0 (0.0%) 1 (1.4%)
81 (57.4%) 54 (38.3%) 2 (1.4%) 4 (2.8%)
81 (57.4%) 18 (12.8%) 6 (4.3%) 24 (17.0%) 1 (0.7%) 11 (7.8%)
3 (2.1%) 59 (41.8%) 72 (51.1%) 4 (2.8%) 1 (0.7%) 2 (1.4%)
continued in next coloumn
ISS: International Staging System; CR: complete response;VGPR: very good partial response; sCR: stringent complete response; PR: partial response; MR: minimal response; SD: stable dis- ease; NC: no change; PD: progressive disease; ASCT: autologous stem cell transplantation; ECOG: Eastern Cooperative Oncology Group; MRD: minimal residual disease.
haematologica | 2021; 106(10)
2703
