
Page 173 - 2021_10-Haematologica-web
P. 173
Carfilzomib or bortezomib in first relapse MM
eight (range, 0-19). At the time of analysis, eight patients were still on treatment, 61 had stopped, of whom 11 patients received the maximum of 18 cycles, and 23 (37.7%) had received fewer than six cycles.
Progression-free survival
All participants in the analysis population were includ- ed in the PFS analysis, with the exception of one patient who progressed prior to maintenance treatment. A total of 107 events were observed (104 disease progression, 3 deaths). Patients in the carfilzomib maintenance arm had significantly longer PFS (median 11.9 months, 80% CI: 8.0, 13.1), than those who did not receive maintenance therapy (median 5.6 months, 80% CI: 4.8, 6.4; HR=0.59, 80% CI: 0.46, 0.77; P=0.0086) (Figure 5A). Disease response at the time of randomization (≥VGPR) was also significantly associated with longer PFS (HR=0.42, 80% CI: 0.32, 0.55; P<0.0001) (Online Supplementary Table S10). The benefit of maintenance was seen across all subgroups
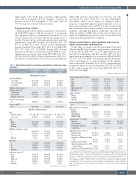
Table 1. Minimization factors for induction randomization, and baseline char- acteristics.
(Figure 5B) and also in patients over 70 years old, who accounted for more than 40% of the participants. Treatment effects were larger for patients whose response to initial therapy was partial response or less or those who had had a prior ASCT. It is also worth noting that treatment effects were similar between patients in standard- and high-risk genetic subgroups, and did not differ according to MRD status at the end of initial treat- ment. No significant interactions were observed between subgroups and maintenance treatment.
Overall survival, time to next treatment and response depth: maintenance randomization
At the time of analysis, 26/138 participants had died. The median OS from the time of maintenance randomiza- tion was 25.7 months (95% CI: 20.8, upper limit not esti- mated) for maintenance and 24.1 months (95% CI: 21.5, upper limit not estimated) for observation (HR=0.86, 95% CI: 0.39, 1.87; P=0.6965). The median time from mainte- nance randomization to next treatment in the mainte- nance arm was 21.4 months (95% CI: 20.3, upper limit not estimated) whereas it was 12.9 months (95% CI: 8.3-27.5) in the control group (Fine and Gray HR=0.59, 95% CI: 0.34-1.02; P=0.0566).
KCd (N=201) VCd (N=99) Total (N=300) n(%) n(%) n(%)
continued from previous coloumn
b2 microglobulin <3.5 mg/L
3.5 to ≤5.5 mg/L >5.5 mg/L
Timing to first relapse or primary refractory
<12 months
≥12 months Primary refractory
Previous bortezomib? Yes
Previous ASCT? Yes
Age
Median (range) ≥70 years
Sex Male
Female Missing
ECOG performance status 0
1
2 Missing
ISS stage I
II
III Missing
Lytic bone disease** None
Mild Moderate Severe Missing
120 (59.7) 53 (26.4) 28 (13.9)
23 (11.4) 175 (87.1) 3 (1.5)
44 (21.9) 133 (66.2)
57 (57.6) 27 (27.3) 15 (15.2)
7 (7.1) 91 (91.9) 1 (1.0)
21 (21.2) 67 (67.7)
177 (59.0) 80 (26.7) 43 (14.3)
30 (10.0) 266 (88.7) 4 (1.3)
65 (21.7)
200 (66.7)
68.0 (32.0, 85.0) 129 (43.0)
179 (59.9) 120 (40.1) 1 (0.3)
168 (56.0) 113 (37.7) 15 (5.0) 4 (1.3)
154 (51.3) 101 (33.7) 44 (14.7) 1 (0.3)
123 (41.0) 51 (17.0) 43 (14.3) 78 (26.0) 4 (1.7)
128 (63.7) 47 (23.4) 0 (0.0) 0 (0.0) 25 (12.4) 1 (0.5)
136 (67.7) 64 (31.8) 1 (0.5)
45 (22.5)
122 (60.7) 33 (16.4) 7 (3.5)
69 (55.6) 55 (44.4)
124
11 (15.9) 43 (62.3)
4 (5.8) 4 (5.8)
63 (63.6) 20 (20.2) 1 (1.0) 1 (1.0) 14 (14.1) 0 (0.0)
64 (64.6) 35 (35.4) 0 (0.0)
23 (23.2)
68 (68.7) 18 (18.2) 1 (1.0)
33 (52.4) 30 (47.6)
63
6 (18.2) 19 (57.6)
4 (12.1) 1 (3.0)
2 (6.0)
1 (3.0)
191 (63.7) 67 (22.3) 1 (0.3) 1 (0.3) 39 (13.0) 1 (0.3)
200 (66.7) 99 (33.0) 1 (0.3)
68 (22.7)
190 (63.3) 51 (17.0) 8 (2.7)
102 (54.5) 85 (45.5)
187
17 (16.7) 62 (60.8)
8 (7.9) 5 (4.9)
8 (7.9)
2 (2.0)
Minimization factors
Heavy chain paraprotein type IgG
IgA
IgM
IgD
Light chain only Missing
Light chain type Kappa
Lambda Missing
Previous lenalidomide? Yes
Other previous treatments regimens
TD/CTD VD/VCD/PAD MP/MPT/VMP
Genetic risk*** (n=187) High risk
Standard risk
Total with confirmed
risk status
Baseline characteristics*
67.0 (41.0, 85.0) 83 (41.3)
115 (57.2) 85 (42.3) 1 (0.5)
114 (56.7) 73 (36.3) 11 (5.5) 3 (1.5)
100 (49.8) 71 (35.3) 29 (14.4) 1 (0.5)
79 (39.3) 35 (17.4) 29 (14.4) 54 (26.8) 4 (2.0)
69.0 (32.0, 82.0) 46 (46.5)
64 (64.6) 35 (35.4) 0 (0.0)
54 (54.5) 40 (40.4) 4 (4.0) 1 (1.0)
54 (54.5) 30 (30.3) 15 (15.2) 0 (0.0)
44 (44.4) 16 (16.2) 14 (14.1) 24 (24.2) 1 (1.0)
High-risk lesions (n=102) Del(17p) only
Gain(1q) only
Any adverse IGH translocation
only
Gain(1q) and del(17p) Gain(1q) and any adverse IGH
translocation
Gain(1q), del(17p) and t(4;14) 1
6
(8.7)
(1.4)
continued in next coloumn
*One participant in the KCd arm was found to be ineligible after randomization, therefore no subsequent data were collected, including baseline characteristics. **Mild = one fracture (any site including vertebrae) or lytic lesion. Moderate = two or three fractures (any site including vertebrae) or lytic lesions. Severe = three or more fractures (any site including vertebrae) or lytic lesions. ***Genetic high risk was defined as at least one of del(17p), gain(1q), or any adverse IgH translocation: t(4;14), t(14;16), or t(14;20). KCd: carfilzomib, cyclophosphamide, dexamethasone; VCd: bortezomib, cyclophosphamide, dexamethasone; ASCT: autologous stem cell transplantation; ECOG: Eastern Cooperative Oncology Group; ISS: International Staging System.
haematologica | 2021; 106(10)
2701
