
Page 174 - 2021_10-Haematologica-web
P. 174
K.L. Yong et al.
Maintenance improved disease response in 13 partici- pants: one patient with stable disease had a minimal response, eight with partial responses developed ≥VGPR, and four with VGPR achieved complete responses. In the control arm, eight participants’ response deepened: seven improved from having partial responses to VGPR and one with a VGPR achieved a complete response. Thus, in the maintenance arm, 10.6% patients achieved a complete response and 50.0% a VGPR as their maximum response overall, compared to 4.2% and 55.6% respectively, in the control arm. Maintenance also increased the rate of MRD negativity (Online Supplementary Figure S2). Maintenance was significantly associated with a higher MRD negative rate at 6 months (24.4% vs. 3.3%; OR=9.66, 95% CI: 1.17, 80.02; P=0.0071). The difference was not statistically sig- nificant at 12 months.
Safety and tolerability of carfilzomib maintenance
Of the 50 patients who stopped carfilzomib mainte- nance therapy early, 40 (80.0%) did so because of disease progression, three stopped due to toxicity (after 5, 6, and 17 cycles), and seven due to the patients’ or clinicians’ choice. Dose modifications were reported for 55 of 67 participants who received treatment (82.1%), with 11.3% of cycles being delayed. The median dose received was 36 mg/m2 (target dose). Thirty-four serious adverse events were reported in 24 participants receiving maintenance: 19 serious adverse events, 15 serious adverse reactions (infection or infestation [n=11]; gas- trointestinal, cardiac, renal and secondary primary malig- nancy [n=1 each), no suspected unexpected adverse reac- tion. In the group not receiving maintenance, six serious adverse events were reported in six participants. Most events (90%) resolved (1 serious adverse event was pres- ent and unchanged, 1 resulted in death, 2 were ongoing at the time of death). Adverse reactions are summarized in Online Supplementary Table S11. Among adverse reac- tions of interest, there was one cardiac adverse reaction (grade 2, chest pain), six cases of acute kidney injury (1
grade 3), four of hypertension (2 grade 3), 25 upper res- piratory tract/bronchial infections (1 grade 3), and six lung infections (3 grade 3). Toxicity did not appear to increase over time.
Landmark analysis of VCd versus KCd-K versus KCd
A post-hoc landmark analysis was performed at 6 months after first randomization to assess PFS for those patients who had not progressed at this time, comparing VCd with KCd plus maintenance (with carfilzomib), and KCd with no maintenance. The median PFS for patients receiving VCd was 6.6 months (95% CI: 4.6, 9.7), similar to that for patients receiving KCd without maintenance (6.2 months, 95% CI: 5.2, 8.0) (Online Supplementary Figure S3). For patients receiving maintenance therapy the medi- an PFS was 12.6 months (95% CI: 8.4, 15.0), reflecting that observed in the primary analysis. The PFS from initial ran- domization for patients receiving KCd followed by carfil- zomib maintenance was also evaluated: among these patients, the median PFS was 18.1 months (95% CI: 14.0,
20.5).
Influence of genetic risk
Genetic risk status at trial entry was available for 187 (62.3%) participants; 55.6% and 52.4% of participants in the KCd and VCd arms, respectively, had adverse-risk genetics (Table 1). Among participants with adverse risk, 78.3% and 63.6% received the planned six cycles of KCd and eight cycles of VCd, respectively, compared to 92.7% and 43.3% of the standard-risk participants (Online Supplementary Table S12). The reason for this difference is unclear, but a greater proportion of standard-risk partici- pants in the VCd arm discontinued therapy.
With respect to the initial treatment, more participants with adverse risk achieved ≥VGPR (over 24 weeks) on KCd compared with VCd (38.2% vs. 21.9%, OR=2.47, 90% CI: 1.07, 5.72), while standard-risk participants had a similar ≥VGPR rate in the two arms (KCd 34.5%, VCd 33.3%, P(interaction)=0.2425) (Online Supplementary Figure
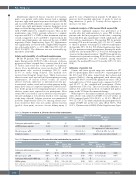
Table 2A. Response to treatment at 24 weeks after the initial randomization. Outcome
KCd vs. VCd comparison
Participants with available response ≥VGPR (primary endpoint)
Overall response: ≥PR Complete response
KCd VCd
194 91 40.2% 31.9%
84.0% 68.1% 1.5% 3.3%
Difference (%), 90% CI
8.3 (-1.6, 18.2)
15.9 (6.8, 25.0) -1.8 (-5.2, 1.7)
OR, 90% CI, P-value
1.48, (0.95, 2.31)
NI comparison so P-value not relevant
2.72, (1.62, 4.55), P=0.0014 Logistic regression not performed
Table 2B. Response to treatment at 24 weeks after initial randomization, by genetic risk.
Outcome
Participants with available response ≥VGPR
Overall response: ≥PR
Participants with available MRD data
MRD negativity
High risk
KCd VCd
68 32 38.2% 21.9% 79.4% 68.8% 52 17
17.3% 17.6%
Standard risk
P-value for interaction
0.2425 0.7403
0.8153
KCd vs. VCd: OR (90% CI)
2.47 (1.07, 5.72) 2.30 (0.98, 5.41)
1.13 (0.32, 3.95)
KCd
55 34.5% 87.3% 41
12.2%
VCd
27 33.3% 70.4% 15 13.3%
KCd vs. VCd: OR (90% CI)
1.06 (0.46, 2.46) 3.00 (1.09, 8.29)
0.85 (0.18, 3.99)
KCd: carfilzomib, cyclophosphamide, dexamethasone; VCd: bortezomib, cyclophosphamide, dexamethasone; OR: odds ratio; CI: confidence interval; VGPR: very good partial response; PR: partial response; NI: non-inferiority; MRD: minimal residual disease.
2702
haematologica | 2021; 106(10)
