
Page 129 - 2021_10-Haematologica-web
P. 129
B-cell evolutionary patterns in NLPHL
cell rich bystander environment of NLPHL. Online Supplementary Figure S2 shows example plots reflecting the distribution of IGHV, IGHD and IGHJ genes in the lym- phoma tissues as well as in non-malignant controls. As expected, the B lineage pattern of NLPHL resembled that of reactive lymphoproliferations, while NHL samples (DLBCL or T-cell/histiocyte-rich large B-cell lymphoma) showed much more pronounced clonal dominance in the B-cell lineage, compatible with the repertoire metrics reported above.
We used two possible criteria to define a malignant clone. We defined a dominant clone with >10% of the repertoire as a malignant clone. A dominant clone was present exclusively in the cases with transformation of cohort 3. In cohorts 1 and 2, the clone fraction of the most frequent clone was never >10% and usually <1% because of pronounced B-cell-rich bystander environment. Our strategy to identify the malignant clone in cases without clonal dominance (all of cohort 2) was to look at the over- lap in paired samples taken at initial diagnosis and relapse. To determine the specificity of an identical rearrangement in lymph node material from the same patient, we ana- lyzed non-malignant lymphadenitis of NLPHL01 and NLPHL02. There was no overlap between the repertoires of lymph nodes affected by lymphadenitis and NLPHL of the same patients (Online Supplementary Figure S3). In ten of 16 cases of cohort 2, there was a single identical rearrangement in the overlap of the paired samples (Figure 3). We defined these clones as malignant clones. One case
A
(NLPHL09) had more than one overlapping clone; howev- er, one of those was far more frequent and additional clones had similar sequences and could have been sub- clones of the malignant clone which had arisen from ongoing mutation.
Overall, we deduced the malignant clone’s rearrange- ment in paired samples from the same patient in about 70% of cases (Figures 3 and 4, Table 1). This is in line with the reported frequency of 66% detection of IGH rearrangements using FR3 primer sets.37 To confirm correct identification by our NGS strategy, we included two cases in our analysis that had been previously studied by Thurner et al.9 using LP-cell microdissection and IGH sequencing (denominated NLPHL01 and NLPHL02 in our cohort and cases 3 and 6 in the cohort described by Thurner et al.9). Indeed, our sequences were identical to the sequences derived from LP-cell microdissection. The characteristics of the malignant clones’ IGH rearrange- ments are reported in Table 1.
We found that the majority of evaluable cases (7 of 11) from cohort 2 showed a characteristic, previously report- ed,9 LP-cell rearrangement containing IGHV3/IGHD3- 3/IGHJ6 gene segments except for one case in which the rearrangement contained IGHD2-2 instead (Table 1). Clones with the characteristic IGHV/D/J LP rearrange- ment showed long CDR3 sequences with a median of 84 nucleotides (termed “longCDR3” rearrangements), while the median length of IGH CDR3 of an average BCR is 51 nucleotides. No “longCDR3” malignant rearrangements
BC
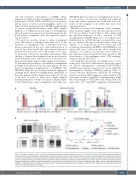
Figure 2. B lineage repertoire metrics of nodular lymphocyte-predominant Hodgkin lymphoma cohorts 1-3 and control cohorts. (A) Clonality, Shannon diversity and richness for different disease groups. High diversity is represented by high Shannon indices. Bars correspond to mean + standard deviation. Statistical test: unpaired, two-tailed t-test. (B) Mean clonal space distributions plotted according to disease entities. (C) Principal component analysis of IGHD/J usage. Two-dimensional sep- aration is plotted according to similarities between repertoires with small distances between samples reflecting very similar repertoires and long distances between samples reflecting very different repertoire distributions. Statistical test: multivariate analysis of variance (MANOVA) Pillai. DLBCL: diffuse large B-cell lymphoma; THRLBCL: T-cell/histiocyte-rich large B-cell lymphoma; NLPHL: nodular lymphocyte-predominant Hodgkin lymphoma; PTGC: progressive transformation of germinal centers; PCA: principal component analysis.
haematologica | 2021; 106(10)
2657
