
Page 48 - 2021_09-Haematologica-web
P. 48
F. Barbaglio et al.
A
B
CD
E
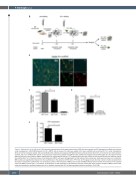
Figure 1. Optimization of the 3D model. (A) Schematic representation of the experimental setup: HS5 cells were seeded into 3D Spongostan scaffolds and cultured under microgravity in a RCCSTM bioreactor for 24 h. MEC1 cells or primary CLL cells were added to the same scaffold and co-cultured for 72 h under microgravity. At the end of the incubation period, cells and scaffolds were collected and analyzed. (B) Representative confocal section taken from an X,Y,Z-stack of a representative scaffold, after 72 h of MEC1-GFP culture in the bioreactor. Nuclei were stained with DAPI and the scaffold was imaged by transmitted light (TL). The square-marked region of interest is also shown at higher magnification for each acquired channel. (C) The graph shows the total number of cells recovered from the medium outside the scaffold after 72 h of dynamic culture in the bioreactor. MEC1 cells were distinguished from HS5 cells by their smaller size. Each experiment was run in triplicate. MEC1 cells were significantly retained into the scaffold only in the presence of HS5 cells (*P=0.01). (D) The graph shows the total number of cells recovered from the medium outside the scaffold after 72 h of dynamic culture in the bioreactor of MEC1 control cells and MEC1-HS1KD cells: the latter were retained in the scaffold more than MEC1 control cells (**P=0.0013). (E) Evaluation of HS1 expression by quantitative real-time polymerase chain reaction analysis in MEC1 control cells inside and outside the scaffolds (experiment run in triplicate) showing that HS1 is down-regulated inside the scaffolds (*P=0.028).
2336
haematologica | 2021; 106(9)
