
Page 41 - 2021_09-Haematologica-web
P. 41
Monitoring of clonal evolution of AML
C
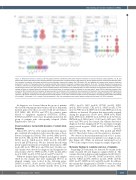
Figure 1. Mutational features of patients. (A) The graphs show the mutational profile after induction treatment in primary refractory cases (patients 1 to 8), and patients who present with both primary refractory disease and relapse after complete remission (CR) (patient 9). (B) The graphs show the mutational profile after induc- tion treatment in patients who present with both primary refractory disease and relapse after CR (patient 10), and patients who relapse after induction treatment (patients 11 to 18). (C) The graphs show the mutational profile after induction treatment in relapse cases (patients 19 to 23). The balls represent the presence of mutations, with their size representing the percentage variant allele frequency (%VAF) and the color representing the moment of evaluation (dx=blue, CR=green, PR and Rf=purple, R=red). Sex, age and type of acute myeloid leukemia are indicated in the individual table, as well as karyotype and treatment administrated. The per- centage of blasts is indicated above the mutation, and the time-frame of treatment cycles is indicated in the same way. y: years; HD-Cyt: high-dose cytosine; Ams: amsacrine; Mit: mitoxantrone; Eto: etoposide, GO: gemtuzumab; Clo: clofarabine; Flu: fludarabine; Ida: idarubicine; Pxf: plerixafor; Dau: daunorubicin; Mid. Midostaurin; allo-HSCT: allogeneic hematopoietic stem cell transplant; auto-HSCT: autologuos hematopoietic stem cell transplant; NA: not available. Dx=diagnosis, CR=complete remission, PR=partial remission and Rf=refractoriness and R=relapse. In the case of several samples at time of evaluation, the samples were labeled sequentially (s1=sample 1, s2=sample 2, s3 = sample 3 and successively). Also, the mutated gene and variant (protein coding) and the exact % of VAF is indicated.
At diagnosis, we observed that in the group of patients who had shown primary refractoriness, the most frequently mutated genes were those associated with tyrosine kinases (KIT, NRAS, CBL, RUNX1) and TP53. By contrast, genes related to epigenetic regulation (DNMT3A, IDH1/2, KMT2A) and SF3B1 were more frequently mutated in the group of patients who subsequently relapsed (Online Supplementary Table S2).
Clonal evolution is involved with dynamics of variant allele frequency
Almost 68% (67.7%) of the variants in the follow-up sam- ples evaluated after induction cycles were the same as those detected at diagnosis (Table 2): TP53 (n=3/4), NRAS (n=3/3), KIT (n=3/3), CBL (n=3/3), RUNX1 (n=2/2), TET2 (n=2/2), ASXL1 (n=1/1), CALR (n=1/1), EZH2 (n=1/3), FLT3-SNV (n=1/1) and ETV6 (n=1/2). We also detected the following newly acquired mutations at treatment refractoriness: MPL (n=2), CBL (n=1), TP53 (n=1), and VHL (n=1). Notably, sev- eral variants were detected at diagnosis and disappeared at refractoriness (32.3%): PHF6 (n=3/3), U2AF1 (n=2/2), JAK2 (n=1/1), EZH2 (n=2/3), ETV6 (n=1/2) and TP53 (n=1/4).
When we analyzed paired relapsed and diagnosis samples (Table 2), the variants that were maintained (80.7%) in relapsed samples were located in the following genes: DNMT3A (n=6/7), SF3B1 (n=3/3), KMT2A (n=4/5), TP53 (n=2/2), IDH2 (n=4/4), FLT3-SNV (n=4/5), TET2 (n=3/4),
ASXL1 (n=3/3), JAK2 (n=2/2), RUNX1 (n=2/2), EZH2 (n=2/2), IDH1 (n=2/2), CBL (n=1/1), NRAS (n=1/5), ETV6 (n=1/1), PHF6 (n=1/1), SRSF2 (n=1/1) and ZRSR2 (n=1/1). In addition, we detected 18 variants that were newly acquired during the progression: SF3B1 (n=3), EPOR (n=3), KRAS (n=2), IDH2 (n=1), KMD6A (n=1), KMT2A (n=1), KIT (n=1), PRPF40B (n=1), SF3A1 (n=1), U2AF1 (n=1), JAK2 (n=1), VHL (n=1) and TP53 (n=1). By contrast, the variants detected at diagnosis but that disappeared (19.3%) in relapsed samples were located in genes: NRAS (n=4/5), DNMT3A (n=1/8), KMT2A (n=1/5), FLT3-SNV (n=1/5), TET2 (n=1/4), VHL (n=2/2) and PTEN (n=1/1). These latter clones could be sensitive to treatment.
We observed a decreased mutational load of 8.1% in sam- ples from treatment refractory patients versus diagnosis sam- ples (Figure 2A). While, an increased mutational load of 3.74% in the relapsed versus diagnosis samples (Figure 2B).
Molecular findings in complete remission of leukemia
Regarding CR evaluation, we detected 81 variants in the study of paired CR and diagnosis samples (Table 2). The variants detected at diagnosis and maintained in CR (34.6%) were located in TET2 (n=4/8), DNMT3A (n=6/10), ASXL1 (n=3/3), NRAS (n=3/9), KMT2A (n=1/2), SF3B1 (n=3/6), IDH2 (n=2/7), SRSF2 (n=3/3) and CBL (n=2/2). In addition, the variants that disappeared in CR (65.4 %) were located in IDH2 (n=5/7), NRAS (n=6/9), DNMT3A (n=4/10), TET2
haematologica | 2021; 106(9)
2329
