
Page 208 - 2021_09-Haematologica-web
P. 208
Letters to the Editor
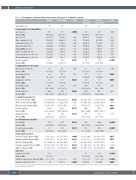
Table 2. Demographics, peripheral blood measurements and outcomes of COVID-19 patients.
Total number (n)
Demographics & Comorbidities
Age (years), n.
Median [IQR]
Male, No. [%]
White ethnicity, No. [%] Smoking history, No. [%] Hypertension, No. [%] Asthma/COPD, No. [%] Diabetes mellitus, No. [%] Ischemic heart disease, No. [%] Chronic kidney disease, No. [%] Histones (μg/mL),
Median [IQR]
Peripheral blood cell counts
White blood cells (x109/L), Median [IQR] Neutrophils (x109/L), Median [IQR] Lymphocytes (x109/L), Median [IQR] Haemoglobin (g/L), Median [IQR]
Platelets (x109/L),
Median [IQR]
Coagulation parameters PT (seconds), Median [IQR] aPTT (seconds), Median [IQR] Fibrinogen (g/L), Median [IQR] D-dimer (ng/mL),
Median [IQR]
Antithrombin (%),
Median [IQR] Pro-inflammatory markers IL-6 (pg/mL),
Median [IQR]
C-reactive protein (mg/L),
Median [IQR]
Organ injury markers
Troponin T (ng/L), Median [IQR] Bilirubin (μmol/L), Median [IQR]
ALT (U/L), Median [IQR]
Creatinine (μmol/L), Median [IQR] SpO2 (%), Median [IQR]
Outcomes
Length of stay (days),
Median [IQR]
Ventilator support (days), Median [IQR]
Mortality at 28 days, No. [%]
Survivors
88
59.0 [45.8, 72.3] 49 [55.7] 72 [81.8] 30 [34.1] 25 [28.4] 25 [28.4] 20 [22.7] 11 [12.5] 13 [14.8] 8.6 [3.1, 24.8]
8.7
[6.1, 11.8] 6.2
[4.0, 8.9] 1.1
[0.8, 1.7] 128.0 [118.0, 144.0] 248.0 [181.0, 299.0]
13.0 [11.8, 14.1] 30.9 [28.4, 32.9] 5.3 [4.1, 6.5] 1166.0 [619.0, 2038.0] 83.0 [62.5, 102.5]
73.9 [36.6, 125.4] 50.0 [15.3, 149.0]
5.0 [10.0, 23.0] 8.0 [5.0, 13.0] 25.0 [12.8, 45.0] 76.0 [61.0, 96.8] 95.0 [93.0, 97.0]
10.0 [3.0, 20.0] 0.0 [0.0, 0.0]
0 [0]
Non-survivors
25
76.0 [66.0, 86.0] 16 [64.0] 24 [96.0] 8 [32.0] 11 [44.0] 4 [16.0] 9 [36.0] 5 [20.0] 2 [8.0] 29.6 [11.2, 60.0]
8.1
[5.2, 11.3] 7.2
[4.0, 11.2] 0.7
[0.4, 1.1] 136.0 [107.0, 147.0] 174.0 [124.0, 250.0]
14.1 [12.4, 20.7] 30.0 [28.2, 37.6] 4.5 [3.1, 4.9] 1630.0 [1117.0, 4334.0] 69.5 [55.8, 81]
107.7 [81.3, 269.8] 105.0 [71.0, 192.0]
35.0 [17.0, 58.0] 12.0 [8.0, 16.5] 28.5 [15.8, 44.3] 102.0 [71.0, 180.0] 92.0 [78.5, 96.0]
-
0.0 [0.0, 0.0] 25 [100]
P valuea
-
<0.001
0.458 0.113 0.845 0.140 0.301 0.180 0.343 0.515 0.002
0.387
0.563
0.001
0.740
0.003
0.028
0.858
0.091
0.017 0.048
0.021 0.013
<0.001 0.041 0.727 0.024 0.005
-
0.347
<0.001
Histones <30 μg/mL
84
63.0 [47.8, 76.0] 48 [57.1] 73 [86.9] 28 [33.3] 28 [33.3] 25 [29.8] 21 [25.0] 13 [15.5] 11 [13.1] 6.1 [2.0, 13.5]
8.0
[5.7, 11.0] 5.7
[3.6, 8.2] 1.2
[0.8, 1.7] 128.0 [118.0, 145.0] 237.5 [174.3, 295.8]
12.8 [11.8, 14.0] 30.7 [28.7, 34.0] 4.7 [3.9, 5.7] 1128.0 [589.0, 1844.3] 82.0 [59.0, 100.4]
71.8 [35.2, 111.4] 48.0 [10.0, 107.5]
10.0 [5.0, 24.0] 8.0 [5.0, 13.0] 20.5 [12.8, 38.3] 76.0 [62.5, 99.3] 95.0 [93.5, 97.0]
8.0
[2.5, 15.5]
0.0 [0.0, 0.0]
12 [14.3]
Histones
≥30 μg/mL 29
66.0 [57.0, 80.0] 17 [58.6] 23 [79.3] 10 [34.5] 8 [27.6] 4 [13.8] 8 [27.6] 3 [10.3] 4 [13.8] 51.6 [38.2, 72.8]
9.8
[6.7, 13.3] 9.1
[6.1, 12.2] 0.8
[0.5, 1.1] 131.0 [116.0, 147.0] 215.0 [155.8, 296.8]
13.8 [13.3, 15.6] 29.5 [28.0, 32.6] 6.6 [4.6, 7.6] 2267.0 [1227.0, 5235.0] 77.0 [69.0, 99.0]
226.2 [90.6, 518.9] 186.0 [108.5, 247.5]
25.0 [9.8, 57.3] 11.0 [85.0, 16.3] 36.5 [25.5, 55.3] 96.0 [65.0, 154.0] 92.0 [85.8, 94.0]
28.0
[13.0, 41.5]
0.0 [0.0, 8.0]
13 [44.8]
P valueb
-
0.224
0.890 0.324 0.910 0.567 0.138 0.783 0.758 >0.999 <0.001
0.084
0.001 0.007 0.740 0.410
0.005
0.268
0.012 0.001
0.971
<0.001 <0.001
0.011 0.016 0.062 0.127 0.001
<0.001
<0.001 0.001
aP value for survivors vs.non-survivors.bP value for toxic histone levels vs.non-toxic.Performed using the Mann-Whitney U test for continuous variables and Fisher Exact/χ2 tests for categorical variables.
2496
haematologica | 2021; 106(9)
