
Page 206 - 2021_09-Haematologica-web
P. 206
Letters to the Editor
Adopting a 30 μg/mL cytotoxic histone threshold,3,7 patients over the threshold (n=29) had significantly high- er D-dimer (2267.0 ng/mL [1227.0-5235.0] vs. 1128.0 ng/ml [589.0-1844.3], P=.001), fibrinogen (6.6 g/L [4.6- 7.6] vs. 4.8 g/L [3.9-5.7], P=0.012), IL-6 (226.2 pg/mL [90.6-518.9] vs. 71.8 pg/mL [35.2-111.4], P<0.001) and CRP levels (186 mg/L [108.5-247.5] vs. 48.0 mg/L [10.0- 107.5], P<0.001) than those patients below the threshold
(Table 2). These patients also had significantly reduced SpO2 compared to those with circulating histones <30 μg/mL (oxygen saturations 92.0% [85.8-94.0] vs. 95.0% [93.5-97.0], P=0.001), required critical care admis- sion (P<0.001), with a longer duration of mechanical ven- tilation (R=0.635) and longer hospital stay (R=0.654).
Circulating histone levels were significantly higher in non-survivors than those who survived (29.6 μg/mL
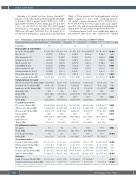
Table 1. Demographics, peripheral blood measurements and outcomes for disease severity groups in COVID-19 infection.
Total number
Demographics & Comorbidities
Age (years), Median [IQR]
Male, No. [%]
White ethnicity, No. [%]
Smoking history, No. [%]
Hypertension, No. [%]
Asthma/COPD, No. [%]
Diabetes mellitus, No. [%]
Ischemic heart disease, No.[%]
Chronic kidney disease, No. [%] Histones (μg/mL), Median [IQR] Peripheral blood cell counts
White blood cells (x109/L), Median [IQR] Neutrophils (x109/L), Median [IQR] Lymphocytes (x109/L), Median [IQR] Haemoglobin (g/L),
Median [IQR]
Platelets (x109/L),
Median [IQR]
Coagulation parameters PT (seconds), Median [IQR] aPTT (seconds), Median [IQR] Fibrinogen (g/L), Median [IQR] D-dimer (ng/mL),
Median [IQR] Antithrombin (%),
Median [IQR]
Pro-inflammatory markers
IL-6 (pg/ml),
Median [IQR]
C-reactive protein (mg/L),
Median [IQR]
Organ injury markers
Troponin T (ng/L), Median [IQR] Bilirubin (μmol/L), Median [IQR] ALT (U/L), Median [IQR]
Creatinine (μmol/L), Median [IQR] SpO2 (%), Median [IQR] Outcomes
Length of stay (days), Median [IQR]
Ventilator support (days), Median [IQR]
Total
113
65.0 [51.0, 78.0] 65 [57.5]
96 [85.0]
38 [33.6]
36 [31.9]
29 [25.7]
29 [25.7]
16 [14.2]
15 [13.3] 10.8 [3.2, 29.9]
8.5 [5.8, 11.8] 6.4 [4.0, 9.3] 1.0 [0.7, 1.6] 129.0
[117.8, 145.3] 236.5 [170.3, 296.0]
13.2 [12.1, 14.4] 30.6 [28.2, 33.6] 4.8 [3.9, 6.5] 1227.0 [687.0, 2141.5] 80.0 [61.0, 100.0]
79.0 [40.5, 131.9] 61.0 [21.0, 153.5]
12.0 [5.0, 35.0] 9.0 [6.0, 14.0] 25.5 [14.5, 45.0] 77.0 [63.0, 105.0] 95.0 [92.0, 97.0]
10.0 [3.0, 20.0]
0.0 [0.0, 0.0]
Mild
30
63.5 [42.0, 70.0] 15 [50.0]
26 [86.7]
10 [33.3]
8 [26.7]
14 [46.7]
5 [16.7]
3 [10.0]
3 [10.0]
2.6 [0.7, 7.6]
8.2 [6.6, 10.7] 5.9 [3.8, 8.0] 1.2 [0.8, 1.7] 126.0
[119.0, 145.0] 253.0 [177.0, 311.0]
12.1 [11.2, 13.0] 31.0 [28.9, 32.7] 4.2 [2.8, 5.4]† 755.5 [431.5, 1744.0] 81.0 [57.5, 98.5]
53.2 [15.0, 83.1] 16.0 [3.5, 53.8]
8.0 [5.0, 16.0]
8.0 [4.5, 13.0] 21.0 [11.5, 55.0] 74.5 [62.0, 82.3] 97.0 [95.0, 98.0]
2.0 [1.0, 13.8]
0.0 [0.0, 0.0]
Moderate
38
67.0 [57.5, 81.5] 20 [52.6]
35 [92.1]
16 [42.1]
12 [31.6]
10 [26.3]
10 [26.3]
8 [21.1]
10 [26.3] 10.5 [3.5, 27.2]*
9.8 [5.9, 12.3] 7.0 [4.1, 9.8] 1.1 [0.8, 1.4] 123.0
[113.8, 139.8] 243.5 [113.8, 139.8]
13.1 [12.1, 14.4]* 30.5 [28.3, 32.6] 4.8 [4.4, 6.7] 1315.0 [832.5, 2176.3] 80.0 [61.5, 97.5]
70.5 [41.9, 115.0] 52.0 [23.3, 146.3]*
16.0 [6.8, 47.3]* 8.0 [6.0, 15.0] 19.0 [11.5, 38.0] 78.0 [60.8, 104.3] 94.5 [92, 96]*
10.0 [6.0, 22.0]*
0.0 [0.0, 0.0]
Critical
20
51.0 [42.8, 54.5]*,¥ 14 [70.0]
11 [55.0]
4 [20.0]
5 [25.0]
1 [5.0]
5 [25.0]
0 [0.0]
0 [0.0]
20.0 [6.2, 33.0]*
8.1 [6.5, 10.8] 6.4 [4.0, 9.0] 1.1 [0.9, 2.1] 134.5
[131.0, 146.0] ¥ 250.5 [207.3, 299.3]
13.4 [13.1, 14.2]* 32.0 [29.1, 33.7] 6.5 [5.4, 6.6]* *950.0 [602.0, 1728.0] 98.0 [80.3, 114.8]*,¥
166.7 [75.6, 214.7]* 145.0 [97.0, 202.5]*,¥
6.5 [5.0, 10.5]¥ 9.0 [6.0, 12.5] 33.5 [29.0, 59.5]¥ 80.0 [57.8, 96.0] 94.0 [92.0, 96.5]*
17.0 [9.5, 43.8]* 2.0 [0.0, 9.3]
Non-survivors
25
76.0 [66.0, 86.0]*,† 16 [64.0]
24 [96.0]
8 [32.0]
11 [44.0]
4 [16.0]
9 [36.0]
5 [20.0]
2 [8.0]
29.6 [11.2, 60.0]*,¥
8.1 [5.2, 11.3]
7.2 [4.0, 11.2] 0.7 [0.4, 1.1]*,¥,† 136.0 [107.0, 147.0] 174.0 [124.0, 250.0]*,¥,†
14.1 [12.4, 20.7] * 30.0 [28.2, 37.6] 4.5 [3.1, 4.9]† 1630.0 [1117.0, 4334.0]*,† 70.0
[59.0, 87.0]†
107.7 [81.3, 269.8]*,¥ 105.0 [71.0, 192.0]*,¥
35.0 [17.0, 58.0]*,† 12.0 [8.0, 16.5]* 28.5 [15.8, 44.3] 102.0 [71.0, 180.0]* 92.0 [78.5, 96.0]*
-
0.0 [0.0, 8.0]
P valuea -
<0.001
0.428
0.001 0.033 0.474 0.005 0.443 0.116 0.025 <0.001
0.623
0.748
0.009
0.122
0.026
0.005
0.775
0.010 0.017
0.024
0.002 <0.001
<0.001
0.142 0.163 0.125 <0.001
<0.001
<0.001
aP value for comparisons mild vs. moderate vs. critical disease vs. non-survivors, collectively. Performed using Kruskall-Wallis test. *Significant vs. mild disease. ¥Significant vs moderate disease. †Significant vs. critical disease.
2494
haematologica | 2021; 106(9)
