
Page 194 - 2021_09-Haematologica-web
P. 194
M.A. Lizarralde-Iragorri et al.
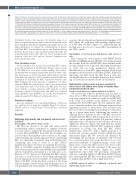
Figure 2. Adhesion to laminin and shear stress resistance of SS red blood cell subpopulations. (A). Adhesion assays under flow conditions were done by perfusing low-density (LD) and high-density (HD) red blood cells (RBC) from seven sickle cell disease (SCD) patients through a biochip coated with Laminin 521. The amount of RBC, of each subpopulation and each blood sample, attached at 1 dyn/cm2 was considered as 100% and used to determine the percentage of attached RBC at increasing shear stress, as indicated on the x-axis. The percentage of HD RBC (■) attached to laminin was higher than the percentage of LD RBC (▲). Paired t-test, **P<0.005. (B) Tracking of mobile cells during a flow adhesion assay for LD (upper panel) and HD (lower panel) RBC at 3 dyn/cm2. (C) Computational treatment of brightfield images of the same field to identify immobile cells between 2 and 3 dyn/cm2 during a flow adhesion assay. Overlaid image (bottom panel) revealing immo- bile cells in dark grey and mobile cells in light grey (D) Quantification of immobile cells for LD (▲) and HD (■) RBC from blood samples of four SCD patients. Results are expressed as percentage of immobile cells between two consecutive shear stress values. Paired t-test, *P<0.05. (E) Representative images of Lu/BCAM detected by immunofluorescence as well as tether length of LD and HD RBC in a flow adhesion assay at high shear stress (7 dyn/cm2). (F) Percentage of tether-containing cells in each RBC subpopulation at 7 dyn/cm2. Paired t-test, *P<0.05. (G) Tether length in LD and HD RBC. Mann-Whitney test, ****P<0.0001.
Modulation Feature, that measures the intensity range of an image, normalized between 0 and 1 (formula: Modulation = Max Pixel - Min Pixel / Max Pixel + Min Pixel), reflecting the fluorescent signal distribution, we defined two subpopulations of mature Lu/BCAM RBC: Low-Modulation (Spots) and High-Modulation (Patches). Based on the x-axis Modulation_M11_Ch11 APC and y-axis Mean Pixel_M11_Ch11 APC, the “Spots” population was between -0.039 and 0.231, and the “Patches” population was between 0.235 and 0.552.
Flow cytometry assays
Protein sialylation was measured by incubating RBC suspen- sions with biotinylated lectin (35 ng/mL) (Maackia amurens Lectin II, VECTOR) for 1 hour with constant shaking. After washes, Streptavidin-488 (10 μg/mL) (Streptavidin Alexa Fluor 488 conju- gate, Invitrogen) was added to the pellet, and incubated for 30 min in the dark. Glycophorin-C (GPC) sialylation on mature RBC was determined by incubating the RBC suspensions with the anti- BRIC 4 (dilution [d]: 1/100) antibody or anti-BRIC 10 (d: 1/200) antibody (IBGRL Research Products). After 1-hour incubation at room temperature and several washes, the RBC pellet was incu- bated with the secondary anti-mouse APC antibody (d: 1/100) (Beckman Coulter) for 45 min in the dark. RBC were analyzed using a BD FACS Canto II (BD Biosciences), the data obtained was analyzed using the FCS Express 6 software (De Novo).
Statistical analyses
Data was analyzed by two-tailed Mann-Whitney or Wilcoxon test, and Paired t-test using the GraphPad Prism 7.00 software. *P≤0.05, **P≤ 0.01, ***P≤0.001 and ****P≤ 0.0001 were considered significant.
Results
Validating high-density and low-density red blood cell isolation
Deformability of AA and SS red blood cells
HD RBC are known to be rigid cells with reduced deformability, which contributes to capillary blockade in vivo. In order to validate the fractionation method used to isolate LD and HD RBC from SCD blood samples, we assessed their deformability after isolation at the single cell level using a microfluidic approach based on perfusing RBC in a spleen-like biomimetic chip with filtering units comprising slits from 5 down to 2 μm31 (Online Supplementary Figure S1). First, we analyzed the deforma- bility of total RBC using this biochip. AA and SS RBC were fluorescently labeled with PKH26 (red) and PKH67 (green), respectively, and mixed at a 1:1 ratio into a sus- pension at 0.1% hematocrit. Perfusing this RBC suspen- sion led to a total blockade of the biochip indicating that the slit dimensions were not suitable for testing deforma- bility of SS RBC. As the blockade occurred at the 5 μm wall we designed a new biochip with slit dimensions of 10 to 5 μm (Figure 1A). Perfusing the 1:1 AA-SS RBC suspen-
sion into this biochip showed preferential trapping of SS RBC (Figure 1B), with these cells showing a higher reten- tion rate than AA RBC (Figure 1C), indicating that the biochip was a good tool to assess RBC deformability in the SCD context.
Deformability of low-density and high-density sickle red blood cells
RBC suspensions were prepared with PKH67-labeled LD RBC and PKH26-labeled HD RBC (1:1) and perfused in the biochip. Both LD and HD RBC were retained in the biochip, mainly at the 5 μm wall, indicating the presence of rigid cells in both populations (Figure 1D). Quantification of both RBC types retained in the 5 μm peripheral slits showed more HD than LD RBC (Figure 1E) indicating that RBC from the HD fraction were less deformable than those from the LD fraction, thus validat- ing our fractionation method based on cell density.
High-density red blood cells are more resistant to shear stress and adhere more firmly to laminin than low-density red blood cells
Red blood cell adhesion to laminin under flow conditions
We assessed the adhesive properties and resistance to shear stress of RBC sub-populations by performing adhe- sion assays under flow conditions with LD and HD RBC from seven SCD patients using channels coated with Laminin 521. Both RBC types showed significant adhe- sion to laminin but there was a difference between them regarding resistance to shear stress. This resistance was first assessed by calculating the percentage of cells adher- ing at a given shear stress considering the number of adhering cells at 1 dyn/cm2 as 100%. HD RBC were more resistant than LD RBC at physiological shear stresses for capillaries or post-capillary venules (2-5 dyn/cm2), while at high shear stress (10 dyn/cm2) both cell types showed no significant difference (Figure 2A). Exploring the cellular dynamics, we observed that LD RBC comprised a higher proportion of rolling cells than HD RBC (Online Supplementary Video S1), with a higher proportion of mobile cells covering a greater distance within the same time frame (Figure 2B). We assessed cell dynamics by determining the percentage of immobile cells between two consecutive shear stress steps. In order to do so, com- putational treatment of brightfield images of the same fields at two consecutive shear stresses was done to iden- tify and count the cells that remained at the same spot between the two time-points (Figure 2C; Online Supplementary Figure S2A). The percentage of immobile cells was constantly higher for HD than LD RBC (Figure 2D), indicating that HD RBC were more firmly attached to laminin than LD RBC even at high shear stress.
Lu/BCAM expression pattern on adherent low-density and high-density red blood cells
2482
haematologica | 2021; 106(9)
