
Page 134 - 2021_09-Haematologica-web
P. 134
J. Duell et al.
A
B
C
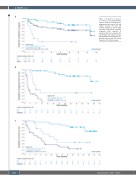
Figure 2. Proportion of patients in remission. (A-C) Kaplan-Meier plots of duration of response (A), progression-free survival. (B) and overall survival (C) after 35 months of follow-up. 95% CI. 95% confidence interval; CR: complete response; DoR: duration of response; NE: not evaluable; NR: not reached; OS: overall survival; PD: progressive disease; PFS: pro- gression-free survival; PR: partial response; SD: stable disease.
2422
haematologica | 2021; 106(9)
