
Page 132 - 2021_09-Haematologica-web
P. 132
J. Duell et al.
months (95% CI: 6.3-45.7) with a median follow-up for PFS of 33.9 months. A total of 38 patients were censored at data cut-off; 21/38 patients (55.3%) were ongoing on PFS follow-up. The Kaplan-Meier plot of PFS suggests a plateau at around 18 months (Figure 2B). The median OS had not been reached at the primary analysis and was 33.5 months (95% CI: 18.3-NR) in this analysis, with a median survival follow-up of 42.7 months. Figure 2C shows the impact of response quality on OS; among the patients with a CR, the median OS was not reached, and OS estimates were 96.9% (95% CI: 79.8-99.6) at 18 months, 90.6% (95% CI: 73.7-96.9) at 24 months, and 81.3% (95% CI: 62.9-91.1) at 36 months. Among patients with a PR, the median OS was 22.5 months (95% CI: 8.6- NR), and OS estimates were 59.8% (95% CI: 28.5-81.0) at 18 months, 42.7% (95% CI: 15.9-67.5) at 24 months and 34.2% (95% CI: 10.7-59.8) at 36 months. In patients who received tafasitamab plus lenalidomide as second-line treatment (n=40), the median PFS was 23.5 months (95% CI: 7.4-NR), the median DoR was 43.9 months (95% CI: 9.1-NR) and the median OS was 45.7 (95% CI: 24.6-NR). In patients receiving tafasitamab plus lenalidomide as third- or later-line treatment (n=40), the median PFS was 7.6 months (95% CI: 2.7-NR), the median DoR was not reached (95% CI: 15.0-NR) and the median OS was 15.5 months (95% CI: 8.6-NR).
Following the discontinuation of treatment in L-MIND, 33 patients received subsequent salvage therapies, which included stem cell transplant in two patients and CAR T- cell therapy in two other patients, following further chemotherapy (see Online Supplementary Results). Additionally, five patients who achieved a CR in L-MIND but discontinued the treatment for reasons other than dis- ease progression were alive at the data cut-off date for this analysis, without further therapeutic intervention.
Subgroup analyses
Overall response and CR rates were consistent regard- less of refractoriness in patient subgroups of clinical inter- est although, as expected, the median PFS and OS were short in patients with primary refractory disease (5.3 months and 13.8 months, respectively), rituximab-refrac- tory and last-line refractory disease (both 7.6 months and 15.5 months, respectively) (Table 2). Forest plots for Kaplan-Meier estimates of 30-month time-to-event end- points are shown in Figure 3. Across DoR, PFS and OS, the only patient subgroup that consistently had a signifi- cantly poorer prognosis than the overall group was that of patients with an intermediate-high and high-risk IPI score. Patients in the rituximab-refractory (n=33 evalu- able) and last-line-refractory (n=35 evaluable) subgroups had similar 30-month DoR and PFS rates to the rest of the population (DoR: 66.2% vs. 65.5% and 57.7% vs. 69.5%; PFS: 40.0% vs. 42.6% and 37.2% vs. 44.2%, respectively), whereas 30-month DoR and PFS rates were lower in patients with primary refractory disease (n=15; DoR: 50.0% vs. 66.7%; PFS: 33.9% vs. 42.3%) (Figure 3A, B). In all refractory subgroups, the 30-month OS rate was lower compared with that of the rest of the population (Figure 3C). Kaplan-Meier plots for PFS in the refractory sub- groups are shown in Online Supplementary Figure S1.
Based on medical history and central pathology diagno- sis, eight patients had DLBCL arising from transformation of low-grade lymphoma, and there was one patient each with double- and triple-hit lymphoma. Of the eight
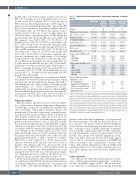
Table 1. Updated baseline characteristics and patient subgroups of clinical interest.
All patients
81
72 (41-86) 45 (56) 2 (1-4)
Stage III/IV, n (%)
Increased LDH, n (%)
IPI 3-5, n (%)
PriorASCT,n(%) 9(11) 0 3(9) 4(11)
Primary Rituximab Last therapy refractory refractory refractory
Number
Median age, years (range)
Age >70 years, n (%)
Median prior lines of treatment (range)
disease
15
73 (48-82) 9 (60)
2 (1-4)
disease
34
72.5 (41-82) 19 (56)
2 (1-4)
disease
36
72.5 (41-82) 20 (56)
2 (1-4)
61 (75) 45 (56) 41 (51)
10 (67) 10 (67) 8 (53)
24 (71) 22 (65) 19 (56)
27 (75) 25 (69) 21 (58)
Cell of origin (by IHC), n (%) GCB
Non-GCB Unknown
Cell of origin (by GEP), n (%) GCB
ABC Unclassified Not evaluable Missing
Patients with transformed lymphoma,* n (%)
B-cell lymphoma
Marginal zone lymphoma NHL unspecified histology Case reported by central pathology review
39 (48) 22 (27) 20 (25)
8 (10) 20 (25) 6 (7) 5 (6) 42 (52)
4 (5) 2 (3) 1 (1) 1 (1)
12 (80) 1 (7) 2 (13)
2 (13) 5 (33) 1 (7) 2 (13) 5 (33)
1 (7) 1 (7) 0
0
21 (62) 6 (18) 7 (21)
5 (15) 8 (24) 1 (3) 3 (9) 17 (50)
2 (6) 0
0
0
21 (58) 8 (22) 7 (19)
5 (14) 8 (22) 4 (11) 3 (8) 16 (44)
2 (3) 1 (3) 0
1 (3)
*Defined from records in the medical history for seven patients with transformed lymphoma and as a current medical condition (ongoing at cycle 1,day 1) for one B-cell lymphoma patient. Refractory subgroups may overlap. Primary refractory disease was defined as progression dur- ing first-line treatment and/or progressive disease or stable disease as response to first-line treat- ment or progressive disease within 6 months after completion of first-line treatment.Rituximab- refractory disease was defined as progressive disease or stable disease in response to any ritux- imab-containing regimen or progressive disease during or within 6 months of completion of any rituximab-containing therapy line.Last therapy-refractory disease was defined as progressive dis- ease or stable disease in response to the most recently administered therapy before study entry. LDH: lactate dehydrogenase; IPI: International Prognostic Index; ASCT: autologous stem-cell transplant; IHC: immunohistochemistry; GCB: germinal center B cell; GEP:gene expression pro- filing; ABC: activated B-cell; NHL: non-Hodgkin lymphoma.
patients with transformed lymphoma, four experienced PR, three experienced CR and one had stable disease as best response. The patient with double-hit lymphoma (MYC and BCL2 translocations) was refractory to his last line of therapy before L-MIND (rituximab-dexametha- sone-cytarabine-cisplatin) and achieved a PR to tafasitam- ab and lenalidomide, and was progression-free for >6 months. The patient with triple-hit lymphoma (MYC, BCL2 and BCL6 translocations) had previously experi- enced a CR for 4.5 months in response to R-CHOP and started tafasitamab plus lenalidomide 1 month after relapse. This patient experienced a CR in L-MIND with sustained remission for >30 months. Swimmer plots for all of these patients are shown in Online Supplementary Figure S2.
Safety outcomes
As of October 30, 2020, the median duration of expo- sure to study treatment (either lenalidomide or tafasitam- ab) was 9.2 months (range, 0.2-54.7). The median dura- tion of exposure to tafasitamab monotherapy (following
2420
haematologica | 2021; 106(9)
