
Page 135 - 2021_09-Haematologica-web
P. 135
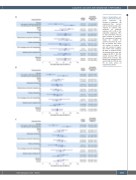
Long-term outcomes with tafasitamab in R/R DLBCL
A Figure 3. Kaplan-Meier esti- mates of 30-month time-to- event endpoints. (A) Duration of response,* (B) progression-free survival and (C) overall survival rates. *Based on patients who achieved an objective response (CR or PR) in the respective subgroups. 95% CI: 95% confidence interval; DoR: duration of response; IPI: International Prognostic Index; nC: number of patients censored; nE: num- ber of patients with event; nR: number of patients at risk; n#: number of respon- ders within each subgroup (A: DoR), or number of over- all patients within each sub- category (B: PFS; C: OS); OS: overall survival; PFS: pro- gression-free survival. The vertical line indicates the 30- month DoR (A), PFS (B) and OS (C) rates across all
responders/patients.
B
C
haematologica | 2021; 106(9)
2423
