
Page 105 - 2021_09-Haematologica-web
P. 105
T cells affect the prognosis of myelofibrosis
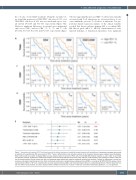
the outcome of ruxolitinib treatment. Using the log-rank test, we found that an increase of CD4+/PD1+ cells above 3.31% or of CD8+/PD1+ cells above 6.12% was associated with a poor over- all survival (P=0.014 and P=0.003, respectively) (Figure 7Ai). However, significant differences in survival were maintained only across CD8+, and not CD4+, TN, TCM, TEM, and TEFF cells (P=0.002, P=0.013, P=0.009, and P=0.007, respectively) (Figure
Ai
ii
iii
B
7Aii-iii), suggesting that increased PD1+ T-cell fractions, typically associated with T-cell exhaustion, are a better predictor of out- come within the cytotoxic T-cell subset. A univariate Cox pro- portional hazard regression analysis of the clinical variables revealed that disease subtype (primary MF vs. secondary MF), BM fibrosis grade (MF-3 vs. MF-1/2), transformation to acute myeloid leukemia, or transfusion dependence were significant
Figure 7. Association of baseline PD1+ T-cell fractions with the clinical outcome of ruxolitinib-treated patients with myelofibrosis. Associations between the survival of patients with myelofibrosis (MF) and percent of PD1+ T cells in differentiation and activation subsets at the treatment baseline were analyzed using the Kaplan- Meier method and Cox models. (A) Kaplan-Meier survival analysis based on percent of PD1+ cells in CD4/CD8 differentiation subsets (i), and in CD4+ (ii) and CD8+ (iii) activation subsets. (B) Results of multivariate analysis of survival using high versus low PD1+/CD4+ and PD1+/CD8+ baseline T-cell subsets are shown. Cutoff val- ues for dichotomization of each subset into high and low groups were determined using the maximally selected rank statistic. P-values for differences in overall sur- vival were calculated using the log-rank test. Each multivariate model also included disease subtype (primary [PMF] vs. secondary MF [PPV/PET MF]), grade of bone marrow fibrosis (MF-3 vs. MF-1/2), transformation to acute myeloid leukemia (AML), and transfusion dependence as confounding predictors. Rhombi depict the haz- ard ratio (HR) of each predictor, and lines represent 95% confidence intervals (CI). P values <0.05 were considered statistically significant. n.s.: not significant.
haematologica | 2021; 106(9)
2393
