
Page 104 - 2021_09-Haematologica-web
P. 104
I. Veletic et al.
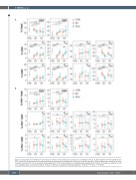
A
B
Figure 6. Association of myelofibrosis T-cell subsets and PD1+ fractions with clinical response to ruxolitinib treatment. (A, B) Comparison of T-cell subset (A) and PD1+ fraction (B) distribution based on spleen response of patients with myelofibrosis 6 months into ruxolitinib treatment. Spleen response was classified as either complete resolution (CR; n=9) or persistent splenomegaly (PS; n=29). CR was defined as no palpable splenomegaly after 6 months of treatment in patients with ≥5 cm of palpable spleen at treatment baseline. P values <0.05 were considered statistically significant. *P<0.05; **P<0.01; ***P<0.001.
2392
haematologica | 2021; 106(9)
