
Page 41 - 2021_06-Haematologica-web
P. 41
Monocytic switch in pediatric BCP-ALL subtypes
but were significantly less frequent among high-hyper- diploid subtypes and extremely rare in ETV6-RUNX1-posi- tive ALL. In addition to 61 patients with monocytic switch in the consecutive cohort, we identified another 19 patients with monocytic switch who belonged to the DUX4r (n=15), PAX5-P80R (n=2), ZNF384r (n=1) and high-hyper- diploid (n=1) ALL subtypes. Nevertheless, except for the DUX4r ALL subtype (representing the subgroup with the highest prevalence of switch, with nearly half of all patients having monocytic switch [30 of 61]), the number of patients was too low (and/or the genomic data were too limited) to study the impact of the broader genomic context on mono- cytic switch occurrence within the individual subtypes. In the DUX4r ALL subtype group, we did not find any associ- ation between monocytic switch and the most frequent secondary genetic aberrations (deletions of ERG, CDKN2A/B, IKZF1 or PAX5 or mutations in the NRAS or KMT2D genes; Online Supplementary Table S2).
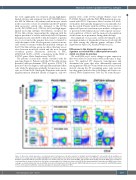
The pattern of monocytic switch correlated with the genotype (Figure 1). Patients with the DUX4r ALL subtype presented with predominant CD19 positive (CD19pos) B- precursor blasts at diagnosis and typically maintained these cells, while the phenotype gradually became more mono- cytic on d+8 and d+15. Among the 25 patients with switch- ing phenomenon identified already at diagnosis, only two
patients were of the DUX4r subtype (Fisher’s exact test P=0.0002). Patients with the PAX5-P80R mutation also pre- sented with CD19pos B precursor blasts, but after d+8, the B- cell markers had typically disappeared concomitantly dur- ing the switch. Patients with the ZNF384 fusion often co- expressed B-precursor and monocytic markers at diagnosis or presented with bilineal disease with separate monocy- toid population of blasts, and the monocytoid population often became more prominent during chemotherapy.
The amplitude of monocytic switch (determined as the maximum number of intermediate B-monocytoid cells) did not differ among the different genetic subtypes (Online Supplementary Figure S3C, Kruskal-Wallis test, n.s.).
Differences in the diagnostic gene expression signature associated with a subsequent monocytic switch are driven by genotype
We used RNA-seq to assess changes in gene expression that were related to monocytic switch at the time of diag- nosis. We analyzed 197 diagnostic transcriptomes and determined the genes that were differentially expressed among patients with (n=73) and without monocytic switch (n=124). Among the 50 top-ranking genes (only protein- encoding genes with absolute fold changes ≥2.5 were con- sidered; Online Supplementary Table S3), we found the pro-
Figure 1. Monocytic switch appearance. In cytometric plots, mononuclear cells after exclusion of doublets and nonmalignant T cells and B cells (if available) are shown. Green, orange and red rectangles highlight the preswitched B-precursor blasts, B-monocytoid intermediate cells and fully switched monocytoids, respectively. Examples of patients with the respective genotypes are shown at day zero (d0) (bone marrow [BM]), d+8 (peripheral blood [PB]) and d+15 (BM). The percentage of each population is shown (of all nuclear cells) in the corresponding color. Polymerase chain reaction (PCR)-determined minimal residual disease (MRD) values in per- centages are shown in black. We observed DUX4r monocytic switch pattern in 43 of 45 patients, PAX5-P80R pattern in seven of seven patients and ZNF384r pattern in three of five patients within the respective genotypes in all patients analyzed (n=745).
haematologica | 2021; 106(8)
2069
