
Page 257 - 2021_06-Haematologica-web
P. 257
Letters to the Editor
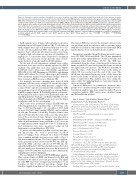
Figure 2. Dynamic contrast enhanced magnetic resonance imaging can help to distinguish normal from leukemic bone marrow in acute myeloid leukemia patient-derived xenograft models. (A) Bone marrow (BM) dynamic contrast enhanced magnetic resonance imaging (DCE- MRI) time intensity curves of non-injected young mice (NI, black), non-injected age-matched mice (NI, dashed black) and mice injected with samples from patients 1-5 with acute myeloid leukemia (AML1-AML5). (B) Quantification of the BM DCE-MRI parameters contrast enhance- ment, wash-in rate, wash-out rate and initial wash-out rate for the mice represented in (A). White circles represent mice with leukemia bur- den <20%. Each dot represents one mouse. White columns represent the average of the group and error bars represent the standard devi- ation of the mean. (C) Pixel by pixel analysis of BM DCE-MRI parameters from mice in Online Supplementary Figure S1F, showing leukemia- induced changes to the BM tissue. White rectangles represent the same area in the BM for that specific mouse. MR: magnetic resonance; NI: not injected; BM: bone marrow; AML: acute myeloid leukemia; DCE-MRI: dynamic contrast enhanced magnetic resonance imaging; CE: contrast enhancement; WiR: wash-in rate; WoR: wash-out rate; iWoR: initial wash-out rate; *P<0.05; **P<0.01; ***P<0.001; ****P<0.0001.
AML samples were obtained after informed consent at St Bartholomew’s Hospital (London, UK). T-cell depleted AML samples were injected intravenously into 8- to 12- weeks old unconditioned NSG mice (2x10⁶ cells per mouse). Ten to 14 weeks after injection, mice were treat- ed with a daily subcutaneous injection of cytarabine (10 mg/kg) for 7 consecutive days. Response to treatment response was assessed 2 weeks after the start of treat- ment, by flow cytometry analysis of BM aspirates.
At the end of each experiment, animals were eutha- nized and bone processed as already reported for FACS analysis.4 The antibodies used were anti-mouse CD45- PerCPCy5 (1:200, eBioscience, #45045182); anti-human CD33-PE (1:100, BD Pharmingen, #555450); anti-human CD45- APC-eFluor 780 (1:100, eBioscience, #47045942). Flow cytometry analysis was performed using a Fortessa flow cytometer (BD Biosciences, Oxford, UK).
For magnetic resonance imaging, mice injected with leukemia cell lines were scanned 2-4 weeks after injec- tion. Mice injected with AML patients’ samples were scanned before and after treatment with cytarabine. MRI was performed on a 9.4 T horizontal bore system (Bruker GmbH) equipped with a B-GA12SH gradient coil system. RF transmission and reception were performed with a 40 mm ID quadrature birdcage coil (Bruker GmbH). A series of fast low-angle shot (FLASH) scans were used for femur localization and for slice positioning.
DCE scans were performed using a FLASH with the following parameters: repetition time = 17.639 ms; echo time = 1.859 ms; flip angle = 10°; repetition = 1100; field of view 30x30x0.5 mm3; matrix 128x128, and resolution of 234 μm. Dotarem (0.4 mL/Kg, Guerbet, France) was injected 4 min after the start of the scan. The total dura- tion of the scan was 41 min. All mice were placed in a head-first prone position for imaging. Anesthesia was induced and maintained using isoflurane (1-4%) in room air supplemented with oxygen (80%/20%). Temperature and respiration rate were monitored using an SA Instruments system (Bayshore, NY, USA).
To assess vascular perfusion in BM vessels by two-pho- ton microscopy, we used a previously described protocol.4 Images were obtained on a Zeiss 710 NLO laser scanning multiphoton microscope with a 20x 1.0 NA water immersion lens. The bone signal (second har- monic generation) was collected at 380-485 nm; GFP sig- nals from AML cells was collected at 500-550 nm; the signal from Qtracker® 655 Vascular Label was collected at 640-690 nm by not descanned detectors. Each z stack of images (100-150 mM) was rendered in three dimensions using Imaris software (Bitplane).
We used Matlab 2019a for all DCE-MRI image analyes. One region-of-interest (ROI) was drawn for the BM and another for the muscle, per scan, per mouse. The signal in each ROI was then averaged and normalized to its baseline, so that it reflected percentage change from baseline. Signals from frames 3-90 were used as baseline.
The muscle ROI was used as the internal control to rule out problems with the injection and/or systemic issues with blood circulation. Mice that showed abnormal DCE muscle kinetics were excluded from the analysis.
Parameters quantified from DCE time intensity curves were CE, WiR, WoR and iWoR. The CE was quantified as the percentage signal difference between baseline and maximum value from frames 95-300. The WiR was determined from the slope of the linear fit between the frame at which CE was reached and the frame at which the signal started to increase. The WoR was determined from the slope of the linear fit between the frame at which CE was reached and the end of the scan. The iWoR was determined from the slope of the linear fit between the frame at which CE was reached and the frame 5 mins later; Pbp analysis was done using the same scripts but applying them to every pixel inside of the bone marrow ROI.
Statistical differences in parameters between mice groups were calculated using two-tailed unpaired t-tests. Correlation analysis was done using two-tailed Pearson correlation analysis. ROC curves were calculated using the Wilson/Brown method.
Ana L. Gomes,1 John Gribben,2 Bernard Siow,3# Diana Passaro1,4# and Dominique Bonnet1#
1Haematopoietic Stem Cell Laboratory, The Francis Crick Institute; 2Department of Haemato-Oncology, Barts Cancer Institute, Queen Mary University of London and 3In Vivo Imaging, The Francis Crick Institute, London, UK
#BS, DP and DB contributed equally as co-senior authors. Correspondence:
DOMINIQUE BONNET - dominique.bonnet@crick.ac.uk DIANA PASSARO - diana.passaro@inserm.fr BERNARD SIOW - bernard.siow@crick.ac.uk doi:10.3324/haematol.2020.277269
Received: December 4, 2020.
Accepted: March 18, 2021.
Pre-published: March 25, 2021. Disclosures: no conflicts of interest to disclose.
Contributions: ALG, DP and DB: wrote the manuscript; ALG, DP and DB designed the experiments; ALG and DP performed experiments and analyzed data; DB and DP secured funding; ALG and BS developed and optimized the MRI protocol;
JG provided human AML samples.
Acknowledgments: the authors would like to thank the Biological Research Facility, Flow Cytometry and In Vivo Imaging core facilities at the Francis Crick Institute for their valuable help. The authors are grateful to Prof. John Gribben (St. Bartholomew’s Hospital, London, UK) for providing human AML samples.
Funding: ALG was supported by an i2i translational grant scheme
haematologica | 2021; 106(8)
2285
