
Page 255 - 2021_06-Haematologica-web
P. 255
Letters to the Editor
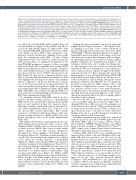
Figure 1. Bone marrow vascular changes in aging and leukemia cell line models, measured by dynamic contrast enhanced magnetic res- onance imaging. (A) Schematic representation of a dynamic contrast enhanced magnetic resonance imaging (DCE-MRI) time intensity curve and the parameters measured. The table explains what each parameter relates to. (B) Bone marrow (BM) DCE-MRI time intensity curves of non-injected mice (black), mice injected with HL60 (red), ML1 (blue) or U937 (olive green). (C) Quantification of BM DCE-MRI parameters CE, WIR, WoR, and iWoR in non-injected mice (NI) and mice injected with either HL60, ML1 and U937. White circles represent mice with a leukemia burden <20%. Each dot represents one mouse. White columns represent the average of the group and error bars represent the standard deviation of the mean. (D) Receiver operating characteristic analysis of the diagnostic capabilities of the BM DCE-MRI parameters to distinguish malignant from non-malignant BM in the cell line model. (E) Pixel by pixel analysis of BM DCE-MRI parameters showing leukemia-induced changes to the BM tissue. For the HL60 and ML1 groups, white rectangles represent the same area in the BM. MR: mag- netic resonance; NI: not injected: AUC: area under the curve; CE: contrast enhancement; WiR: wash-in rate; WoR: wash-out rate; iWoR: initial wash-out rate; *P<0.05; **P<0.01; ***P<0.001; ****P<0.0001.
ease. Mice injected with AML1 had the highest degree of vascular dysfunction (Figure 2A, B), which could also be seen in the pbp analysis (Figure 2C, AML1). Mice from the remaining AML PDX experiments showed no signif- icant changes in CE or WoR, when compared to age- matched controls (old NI mice), similarly to the results from the experiments with AML cell lines (Online Supplementary Figure S1E). However, grafts from all the AML patients induced a significant deregulation of the four DCE-MRI parameters compared to those in young NI controls (Figure 2B). As hypothesized, averaged DCE- MRI vascular parameters were not sensitive enough to detect altered BM vasculature in the AML PDX model of low disease burden (<20% hCD33+ cells present in the BM) (Figure 2B, open circles), a limitation that we were able to overcome with pbp analysis (detailed below). Our data highlight the heterogeneous nature of the primary disease compared to cell line models. However, regard- less of the broad spectrum of vascular dysfunction, the reduction in BM vascular perfusion (WiR) was again the most significantly affected parameter (Figure 2B) in AML PDX, with ROC curve analysis showing that WiR is of clinical relevance in distinguishing normal from leukemic BM (Online Supplementary Figure S2B).
To determine whether DCE-MRI could be used to monitor the BM vascular response to chemotherapy, PDX cohorts were treated with a standard chemotherapy protocol and analyzed during the remission phase. Although cytarabine significantly reduced leukemia bur- den (Online Supplementary Figure S2C), it did not rescue the altered BM vascular phenotype. BM vascular response to cytarabine treatment was diverse, with some groups showing partial rescue (AML1, AML2), and other groups showing no effect at all (Online Supplementary Figure S2D).
Pbp analysis showed that vascular dysfunction in some AML samples was located in the whole or most of the diaphysis (AML1, AML3), while in others it was located in small pockets (AML2). Mice injected with sample AML1 exhibited severe BM vascular dysfunction throughout the whole diaphysis, with hardly any per- fused pixels (Figure 2C). Cytarabine treatment partly res- cued the lack of vascularity in the diaphysis but could not rescue either the vascular perfusion or permeability (Figure 2C, AML1). Even though AML3 did respond to cytarabine treatment (Online Supplementary Figure S2C), it showed great similarities with AML1 in terms of most of the vasculature in the diaphysis being compromised, with little to no perfused pixels corresponding to high vascular permeability areas (Figure 2C, AML3). AML4 and AML5 showed similar patterns of pixel distribution. Before therapy, both AML samples showed a modest effect on BM vasculature, and for both samples, cytara- bine treatment seemed to worsen the phenotype for both perfusion and permeability (Figure 2C, AML4 and AML5).
Imaging the microenvironment can provide important insights and has diagnostic power.11,12 In leukemia, clini- cal imaging is not part of the routine follow-up of patients, although clinical studies have shown the utility of DCE-MRI.5,13 Our preclinical imaging data, focusing on femoral BM, sheds some lights on the nature of the vas- cular microenvironment involvement in AML at diagno- sis and during remission, and our in-house image analysis pipeline maximizes the translational potential of the technique, without the need of complex modeling analy- sis. This strategy resolves the caveats encountered with standard model-based quantification of the parameters, whose clinical relevance depends strongly on the mathe- matical model chosen.14 Our results pave the way for the implementation of a novel human BM tailored DCE-MRI model which would help to provide an absolute or cor- relative biomarker in clinical settings. Among the various parameters analyzed, the WiR has the best diagnostic potential as measured by ROC analysis. This could potentially be helpful in the scenario of long-term dis- ease, patients’ refusal to have a bone marrow puncture, or high-risk and/or older patients in whom frequent and thorough follow-up monitoring might be a value. Future clinical investigations will be needed to formally address the utility of this technique.
We were also able to show that vascular dysfunction occurs in healthy aging. Recent reports suggest that a damaged BM niche could have a role in the aging process of the hematopoietic system.15 High vascular permeabili- ty being associated with increased HSC activation and egress from the niche,8 our data are in line with these findings and point to a possible therapeutic benefit from restoring normal vascular functionality.
All animal experiments in this study were performed under the project license (PPL 70/8904) approved by the UK Home Office and in accordance with the Francis Crick Institute AWERB (Animal Welfare and Ethics Review Board) guidelines. NOD.Cg-PrkdcscidIl2rgtm1WjI (NSG) strains were obtained from Jackson Laboratory (Bar Harbor, ME, USA) and were bred in-house.
Cell lines (HL60, ML1, U937) came originally from the American Type Culture Collection (distributor LGC stan- dards, UK) and were grown by our cell service at the Institute. Before use, these lines were authenticated using short tandem repeat profiling. Once authenticated, 2x10⁶ cells per mouse were injected intravenously into NSG mice of different ages. BM engraftment was assessed by FACS analysis of BM aspirate 2-4 weeks after injection. For specific experiments, cell lines were transfected with GFP-Luciferase lentivirus vector, as previously described.4
The collection and use of all human samples were approved by the East London Research Ethical Committee (REC:06/Q0604/110) and performed in accordance with the Declaration of Helsinki. Umbilical cord blood samples were obtained from normal full-term deliveries after signed informed consent.
haematologica | 2021; 106(8)
2283
