
Page 136 - 2021_06-Haematologica-web
P. 136
H. Al-Samkari et al.
also received an additional four induction infusions administered every 4 weeks. Induction courses typically lasted 2-4 months but never extended beyond 6 months. A total of 181 patients received maintenance treatment, which was defined as additional bevacizumab doses administered to prevent or treat recurrent bleeding after completion of the initial induction infusion course. These maintenance doses were administered using one of two different protocols. The majority of patients (n=136) received continuous maintenance, defined as bevacizum- ab administered on a regular schedule every 4-12 weeks. The remainder (n=45) received intermittent maintenance, defined as retreatment only following recurrence or wors- ening of bleeding symptoms or anemia, with one to four doses administered every 2 weeks once the need for maintenance was triggered. Ninety-two percent of patients were given maintenance doses of 5 mg/kg per infusion (regardless of maintenance schedule) but doses of 1, 2.5, 3, and 7.5 mg/kg were also used occasionally. Compared with the relatively universal induction dose intensity of 10.0 mg/kg/month, mean maintenance dose intensity was 4.0 mg/kg/month in patients receiving con- tinuous maintenance and 3.0 mg/kg/month in patients receiving intermittent maintenance.
Effect of bevacizumab on hemoglobin concentration
Of the 197 anemic (Hb <11 g/dL) patients treated, 185 patients had been treated for ≥3 months and were includ- ed in the hemoglobin analysis. Mean hemoglobin increased by 3.2 g/dL (95% confidence interval [95% CI]: 2.9-3.4, P<0.0001) from baseline following bevacizumab treatment (Table 2). In the evaluation of on-treatment mean hemoglobin, freedom from anemia (Hb ≥11 g/dL) was observed in 67% (n=123/185) of patients. In the eval- uation of hemoglobin values at each time point, freedom from anemia was observed in 64% of patients at 3
months, 73% at 6 months, 76% at 9 months, and 71% at 12 months (Figure 1A). The change in hemoglobin con- centration from baseline to on-treatment ranged from a 1.0 g/dL reduction to a 7.9 g/dL increase. A mixed linear model estimated the improvement in mean hemoglobin at between 3.0 g/dL (95% CI: 2.7-3.3 g/dL; P<0.0001) and 3.4 g/dL (95% CI: 3.1-3.7 g/dL; P<0.0001) at each time point, stable over the course of treatment (Online Supplementary Table S2, Online Supplementary Figure S1A).
Effect of bevacizumab on Epistaxis Severity Score
Of the 175 patients treated for epistaxis with complete ESS data available, 146 patients had been treated for ≥3 months and were included in the ESS analysis. Mean ESS decreased by 3.37 points (95% CI: -3.69 to -3.05; P<0.0001) from baseline following bevacizumab treat- ment (Table 2). Change in ESS from baseline to on-treat- ment ranged from a 1.92-point increase to a 10-point reduction. A clinically meaningful reduction in epistaxis (ESS decrease of ≥0.71 post-treatment) was seen in 92% (n=132/146) of patients. The ESS reduction was evident by 3 months (Figure 1B). A mixed linear model estimated the decrease in mean ESS to be between -2.96 (95% CI: - 3.26 to -2.66; P<0.0001) and -3.73 (95% CI: -4.05 to -3.43; P<0.0001) at each time point, stable over the course of treatment (Online Supplementary Table S2, Online Supplementary Figure S1B).
Effect of bevacizumab on red blood cell transfusion
All patients
A total of 191 patients who had been treated for ≥6 months had complete RBC transfusion data available and were included in the RBC transfusion analysis. In analysis of all included patients (those who required RBC transfu- sion in the 6 months pretreatment and those who did not), the median number of RBC units transfused
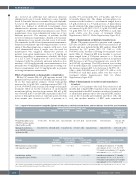
Table 2. Impact of bevacizumab on hemoglobin, Epistaxis Severity Score, red blood cell transfusions, and iron infusions over the first year of treatment. Hemoglobin and Epistaxis Severity Score
Outcome
Hemoglobin (g/dL), mean (95% CI), baseline anemia (Hb<11 g/dL) (n=185)
Epistaxis Severity Score, mean (95% CI), treated for epistaxis (n=146)
Outcome
Baseline
8.6 (8.5, 8.8)
6.81 (6.56, 7.06)
3 months
11.6 (11.3, 11.9)
3.84 (3.49, 4.18)
6 months
12.1 (11.8, 12.4)
3.02 (2.73, 3.31)
9 months
12.0 (11.7, 12.4)
3.07 (2.70, 3.45)
12 months
12.1 (11.7, 12.4)
3.22 (2.81, 3.62)
Mean
on treatment
11.8 (11.5, 12.1)
3.44 (3.17, 3.71)
Baseline vs. mean on treatment, mean difference (95% CI)
+3.2 (2.9, 3.4) P<0.0001*
-3.37 (-3.69, -3.05) P<0.0001*
RBC transfusions, units, median (interquartile range) (N=191)
Iron infusions, median (interquartile range) (N=183)
6 months pretreatment
6.0 (0.0-13.0)
6.0 (1.0-18.0)
First 6 months on treatment
0.0 (0.0-2.0)
1.0 (0.0-4.0)
Second 6 months on treatment
0.0 (0.0-0.0)
0.0 (0.0-2.0)
Pretreatment vs. on treatment, median difference (95% CI)
6 months pretreatment vs. 1st 6 months on treatment: -4.0 (-6.0, -3.0), P<0.0001† 1st 6 months on treatment vs. 2nd 6 months on treatment: 0.0 (0.0, 0.0), P=0.0005†
6 months pretreatment vs. 1st 6 months on treatment: -4.0 (-6.0, -1.0), P<0.0001† 1st 6 months on treatment vs. 2nd 6 months on treatment: 0.0 (0.0, 0.0), P<0.0001†
RBC transfusion and iron infusion
*By a paired t-test. Normality for hemoglobin and Epistaxis Severity Score data confirmed with the D’Agostino and Pearson test. †By the Wilcoxon signed-rank test. 95% CI: 95% confi- dence interval; ESS: Epistaxis Severity Score; RBC: red blood cell.
2164
haematologica | 2021; 106(8)
