
Page 92 - 2021_07-Haematologica-web
P. 92
K. Klausz et al.
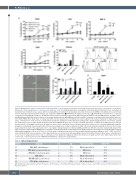
A
B
CD
Figure 4. MSH-TP15 Fc-engineered efficiently recruits natural killer cells for antibody-dependent cell-mediated cytotoxicity and engages macrophages for antibody- dependent cellular phagocytosis of myeloma and lymphoma cells. (A) Antibody-dependent cell-mediated cytotoxicity (ADCC) experiments were performed as standard 3-hour chromium release assays with increasing antibody concentrations and peripheral blood mononuclear cells (PBMC) of healthy donors at an E:T ratio of 80:1. Antibody-mediated myeloma cell lysis was analyzed for MSH-TP15 (), MSH-TP15 Fc-engineered (Fc-eng.). (▲), MSH-TP15 Fc knockout (Fc k.o.). (∇) and control monoclonal antibodies (mAb) (, ) with the indicated cell lines. (B) ADCC experiments with patient-derived tumor cells from BM aspirates of multiple myelo- ma (MM) patients (P#1-P#4), pleural effusion of an extramedullary myeloma (EM-MM) patient (P#5) and PB of a plasma cell leukemia (PCL) patient (P#6) were per- formed with PBMC (80:1; black bars) or natural killer (NK) cells (10:1; grey bars) of healthy donors and 10 μg/mL of the indicated antibodies. Graph shows mean values ± standard error of the mean of six independent experiments. Histograms on the right show staining of the CD138+ malignant plasma cells of these patients (for details please refer to Table 2) with Alexa Fluor 755-labeled MSH-TP15 (grey line) or control (ctrl) IgG1 (black line). (C) Apoptosis of INA-6 myeloma cells was measured by life cell imaging over 24 hours (h). Apoptotic tumor cells became green fluorescent when intracellular caspases were activated. Right graph shows the total green counts/image measured after 24 h in the presence (black bars) or absence (grey bars) of NK cells and the indicated antibody. Pictures on the left show images taken from start of the experiment (0 h), 6, 12 and 24 h during incubation of myeloma (MM) and NK cells (NK; E:T ratio 10:1; marked with arrows in the upper left picture) with 20 mg/mL MSH-TP15 Fc-eng. (D) For antibody-dependent cellular phagocytosis (ADCP) analyses macrophages were incubated with 10 mg/ml mAb and Raji lymphoma cells at an E:T ratio of 1:3. Percentage of phagocytosed tumor cells was quantified by flow cytometry gating on CD14+, CFSE+ and CD19– cells. Rituximab (RTX) served as positive control. Experiment was repeated six times with macrophages derived from different donors. Mean values ± standard error of the mean of phagocytosed tumor cells is summarized in the graph with significant differences between ctrl IgG1 and the other mAb marked with stars. ***P<0.001, **P<0.01 and *P<0.05 of MSH-TP15 mAb/RTX vs. ctrl IgG1 for all experiments.
Table 2. Patient characteristics.
Patient
#1
#2 #3 #4 #5
#6
Diagnosis
Sex Age
f 67y
f 70y
m 56y
m 54y
f 70y
f 67y
Source of material
BM, freshly isolated
BM, frozen
BM, frozen BM, freshly isolated PE, freshly isolated PB, freshly isolated
CD138+ PC
30%
63%
58%
35%
93%
80%
MM (IgM), initial diagnosis
MM (IgAl), progressive disease MM (IgG), refractory, progress MM (IgGκ)
EM-MM (IgGl), active disease
PCL (IgGκ), active disease
MM: multiple myeloma; Ig: immunoglobulin; PC: plasma cell; PCL: plasma cell leukemia; EM: extramedullary; f: female; m: male; y: years; BM: bone marrow; PB: peripheral blood; PE: pleural effusion.
1862
haematologica | 2021; 106(7)
