
Page 191 - 2021_07-Haematologica-web
P. 191
Lenalidomide induction and maintenance in MM
of treatment effect observed (Figure 2).
PFS2, a secondary endpoint, was also analyzed. CRD
was associated with significantly longer PFS2 than was CTD (HR, 0.76; 95% CI: 0.65-0.90; P=0.001) (Online Supplementary Figure S2). The median PFS2 was 59 months (95% Cl: 55-63) with CRD and 54 months (95% CI: 49- 60) with CTD.
Response
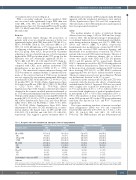
After induction triplet therapy, the proportion of patients with a very good partial response or better was significantly higher with CRD than with CTD (60.4% vs. 52.9%; P=0.0006) (Table 2). The odds ratio (OR) of 1.37 (95% CI: 1.15-1.65) indicates a 37% increase in the odds of achieving a deep remission in the CRD group than in the CTD group. After ASCT, the proportion of patients achieving a very good partial response or better remained higher in the CRD group than in the CTD group, but the difference was not statistically significant (81.5% vs. 76.9%; OR, 1.25; 95% CI: 0.94-1.66; P=0.1277) (Table 2).
Due to the lower induction response rate with CTD compared with CRD, more patients underwent CVD intensification as per protocol (CRD, 11.8% vs. CTD, 13.3%). The interaction between induction therapy and CVD was therefore examined further. Counterfactual esti- mates of the survivor function if CVD rescue treatment was not received by any patients maintained differences in median PFS (CRD: 36 months [95% CI: 33-39] vs. CTD: 33 months [95% CI: 30-34]) (Online Supplementary Figure S3A) and 3-year OS rate (CRD: 82.9% [95% CI: 80.0-85.5] vs. CTD: 76.3% [95% CI: 73.0-79.2]) (Online Supplementary Figure S3B). Similar counterfactual estimates obtained in the scenario in which patients randomized to no CVD after partial/minimal response were treated with CVD provided similar estimates for median PFS (CRD: 36 months [95% CI: 33-39] vs. CTD: 33 months [95% CI: 31- 36]) (Online Supplementary Figure S3C) and 3-year OS rate (CRD: 83.1% [95% CI: 80.2-85.6] vs. CTD: 77.3% [95% CI: 74.1-80.2]) (Online Supplementary Figure S3D). After adjustment for the effect of CVD treatment in a counter- factual analysis, the hazard ratios for PFS and OS were 0.82 (95% CI: 0.69-0.96) and 0.69 (95% CI: 0.53-0.91), respectively. This suggests a greater treatment effect of
CRD induction treatment on PFS and particularly OS than apparent with the unadjusted intention-to-treat analysis (Online Supplementary Figure S3A and S3B, respectively). The full results of the CVD intensification randomization have been presented elsewhere.22
Safety
The median number of cycles of induction therapy delivered was five (range, 1-18) for CRD and five (range, 1-12) for CTD. The median percentage of minimum pro- tocol-defined delivered dose of lenalidomide and thalido- mide during induction therapy was 116.7% (IQR, 96.4- 150.0) and 100.0% (IQR, 71.4-128.6), respectively. Lenalidomide dose modifications occurred in 391 (38.3%) patients who received CRD induction therapy, and thalidomide dose modifications occurred in 751 (73.6%) patients who received CTD induction therapy. The rate of discontinuation of induction therapy due to adverse events was similar with CRD and CTD (51 patients [5.0%] and 68 patients [6.7%], respectively). Overall, 64.4% of patients proceeded to ASCT following induction with or without intensification. There was no difference in the proportion of patients undergoing ASCT between those receiving CTD (63.3%) or CRD (65.5%) induction suggesting this was not due to induction-related toxicity. The most common reason for not proceeding was “Patient not fit/clinician’s decision” in 36.1% of cases.
Differences in the safety profile of CRD and CTD were consistent with the known side effects of lenalidomide and thalidomide (Table 3). In general, CRD was associated with a higher rate of grade ≥3 neutropenia (22.3% vs. 11.7%) and diarrhea (2.6% vs. 1.0%), whereas CTD was associated with a higher rate of grade ≥3 peripheral senso- ry neuropathy (1.5% vs. 0.6%) and constipation (1.9% vs. 0.8%). The incidence of deep vein thrombosis was 5.7% in the CRD group and 4.8% in the CTD group; pulmonary embolism was reported in 3.2% and 4.9% of patients, respectively.
The 3-year cumulative incidence of invasive second pri- mary malignancies (SPM) was low and comparable between CRD and CTD (2.9% [95% CI: 1.7-4.1] vs. 1.5% [95% CI: 0.6-2.4]; HR, 1.60 [95% CI: 0.87-2.93]; P=0.1311). The SPM incidence rate per 100 patient-years
Table 2. Response rates after induction and autologous stem-cell transplantation. Response following induction therapy
Response following ASCT
Response, n (%)
CR or VGPR CR
CR w/o BM VGPR
PRorMR PR
MR
SDorPD SD
PD
Death within 100 days after ASCT Unknown
CRD (n=1,021)
617 (60.4) 87 (8.5) 297 (29.1) 233 (22.8)
297 (29.1) 261 (25.6) 36 (3.5)
32 (3.1) 8 (0.8) 24 (2.4)
13 (1.3)
57 (5.6)
CTD (n=1,021)
540 (52.9) 61 (6.0) 223 (21.8) 256 (25.1)
348 (34.1) 301 (29.5) 47 (4.6)
43 (4.2) 8 (0.8) 35 (3.4)
17 (1.7)
61 (6.0)
CRD (n=628)
512 (81.5) 149 (23.7) 218 (34.7) 145 (23.1)
95 (15.1) 94 (15.0) 1 (0.2)
11 (1.8) 0 (0.0) 11 (1.8)
1 (0.2)
9 (0.9)
CTD (n=603)
464 (76.9) 122 (20.2) 214 (35.5) 128 (21.2)
102 (16.9) 98 (16.3) 4 (0.7)
10 (1.7) 0 (0.0) 10 (1.7)
6 (1.0)
21 (2.1)
ASCT: autologous stem cell transplantation; CR: complete response; CR w/o BM: complete response by immunological criteria without confirmation by bone marrow; CRD: cyclophosphamide, lenalidomide, and dexamethasone; CTD: cyclophosphamide, thalidomide, and dexamethasone; MR: minimal response; PD: progressive disease; PR: partial response; SD: stable disease;VGPR: very good partial response.
haematologica | 2021; 106(7)
1961
