
Page 190 - 2021_07-Haematologica-web
P. 190
G.H. Jackson et al.
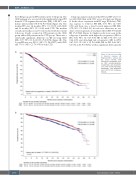
the CRD group and in 509 patients in the CTD group. The CRD regimen was associated with significantly longer PFS than the CTD regimen (hazard ratio [HR], 0.85; 95% con- fidence interval [CI]: 0.75-0.96; P=0.0116) (Figure 1A). The median PFS was 36 months (95% Cl: 33-39) with CRD and 33 months (95% CI: 31-35) with CTD. The median overall survival has not yet been reached with the current follow-up. Death occurred in 185 patients in the CRD group and in 230 patients in the CTD group. There was a statistically significant difference in OS favoring CRD (HR, 0.77; 95% CI: 0.63-0.93; P=0.0072) (Figure 1B). The 3-year OS rate was 82.9% (95% Cl: 80.2-85.7) with CRD and 77.0% (95% CI: 73.9-80.0) with CTD.
Subgroup analyses indicated that PFS and OS were bet- ter with CRD than with CTD across all subgroups (Figure 2). In the subset of patients with ISS stage III disease, CRD was superior to CTD for PFS (HR, 0.73; 95% CI: 0.58- 0.93) and there was a trend toward improved OS (HR, 0.78; 95% CI: 0.56-1.09). In each case, there was no evi- dence of heterogeneity of treatment effect (PFS: P=0.2645; OS: P=0.7606) (Figure 2). Similar results were seen in the subgroup of patients with high-risk cytogenetics (HR for PFS, 0.60; 95% CI: 0.43-0.84; HR for OS, 0.70; 95% CI: 0.42-1.15) and ultra-high risk cytogenetics (HR for PFS, 0.67; 95% CI: 0.41-1.11; P=0.6164; HR for OS, 0.65; 95% CI: 0.34-1.25; P=0.8131), with no significant heterogeneity
A
Figure 1. Outcomes according to induction regimen. (A) Progression-free survival and (B) overall survival, with dashed line showing the medi- an. CRD: cyclophosphamide, lenalidomide, and dexametha- sone; CTD: cyclophosphamide, thalidomide, and dexametha- sone; 95% CI: 95% confidence interval.
B
1960
haematologica | 2021; 106(7)
