
Page 93 - 2021_06-Haematologica-web
P. 93
ATG vs. PTCy in haploidentical transplantation in ALL
32.9% (95% CI: 23.1-43.1) and 26.7% (95% CI: 21.8-31.8) in the ATG and PTCy groups, respectively (P=0.23) (Table 2). On multivariate analysis, there was no significant dif- ference in non-relapse mortality between the groups (HR=0.68, 95% CI: 0.42-1.11; P=0.12). Independently of whether patients received ATG or PTCy as GvHD pro- phylaxis, pre-transplant status of being in second or fur- ther complete remission or having advanced disease was associated with higher rates of non-relapse mortality (Table 3). A Karnofsky Performance Score ≥90 was associ- ated with a lower non-relapse mortality rate (HR=0.46, 95% CI: 0.30-0.7; P=0.0003). Use of TBI in conditioning was associated with lower non-relapse mortality (HR=0.59, 95% CI: 0.38-0.92; P=0.02) compared to regi- mens containing only chemotherapy.
The cumulative incidence of ALL relapse at 2 years was similar between the ATG and PTCy groups, being 43% (95% CI: 32-53.5) and 33.8% (95% CI: 28.1-39.5), respec- tively (P=0.11) (Table 2). On multivariate analysis, PTCy as GvHD prophylaxis was associated with a lower risk of
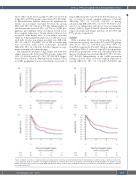
relapse (HR=0.61, 95% CI: 0.39-0.94; P=0.03). Disease sta- tus., i.e. being in second complete remission or beyond (HR=2.06, 95% CI: 1.32-3.21; P=0.001) or having advanced ALL (HR=4.99, 95% CI: 3.13-7.93; P<10-5) were noted to be independent risk factors for post-transplant relapse (Table 3). Figure 1A and B show the adjusted non- relapse mortality and relapse incidence in the ATG and PTCy groups, respectively.
Survival
With a median follow-up of 24 months, the 2-year leukemia-free survival rates in the ATG and PTCy groups were 24.1% (95% CI: 14.5-33.8) and 39.6% (95% CI: 33.6-45.5), respectively (P=0.007) (Table 2). On multivari- ate analysis (Table 3), relative to the ATG group, patients in the PTCy group had a lower risk of therapy failure (the inverse of leukemia-free survival) (HR=0.67, 95% CI: 0.46- 0.97; P=0.03). Independently of the GvHD prevention strategy, a disease status of second complete remission of beyond (HR=1.91, 95% CI: 1.37-2.66; P=0.0001) and
AB
CD
Figure 1. Adjusted outcomes of patients with acute lymphoblastic leukemia undergoing haploidentical transplantation stratified by type of graft-versus-host dis- ease prophylaxis. Data for recipients of anti-thymocyte globulin are shown in blue, those for recipients of post-transplant cyclophosphamide are shown in red. (A) Adjusted incidence of non-relapse mortality (NRM). (B) Adjusted relapse incidence (RI). (C) Adjusted estimates of leukemia-free survival (LFS), (D) Adjusted estimates of overall survival (OS).
haematologica | 2021; 106(6)
1595
