
Page 91 - 2021_06-Haematologica-web
P. 91
ATG vs. PTCy in haploidentical transplantation in ALL
two cohorts (reducing intensity/myeloablative conditioning) were compared using χ2 statistics for categorical variables and the Mann-Whitney test for continuous variables. Survival statistics (leukemia-free survival, overall survival and GRFS) were estimated by the Kaplan-Meier method. Cumulative incidence functions were used to estimate neutrophil engraftment, acute GvHD, chronic GvHD, relapse incidence and non-relapse mortality. Competing risks were death for engraftment and relapse inci- dence, relapse for non-relapse mortality, and relapse or death for acute and chronic GvHD. Univariate analysis (Online Supplementary Table S1) was carried out using the log-rank test for GRFS, overall survival and leukemia-free survival, and the Gray test for cumulative incidence functions. A Cox proportional haz- ards model was used for multivariate regression. All variables dif- fering significantly between the two groups or factors associated with one outcome in univariate analysis were included in the Cox model. To test for a center effect, we introduced a random effect or frailty for each center into the model.22,23 Results are expressed as a hazard ratio (HR) with a 95% confidence interval (95% CI). All tests were two-sided. The type I error rate was fixed at 0.05 for the determination of factors associated with time-to-event out- comes. Statistical analyses were performed with SPSS 24.0 (SPSS Inc, Chicago, IL, USA) and R 3.4.0 (R Core Team [2017]. R: A lan- guage and environment for statistical computing. R Foundation for Statistical Computing, Vienna, Austria. URL https://www.R- project.org/).
Results
Baseline characteristics
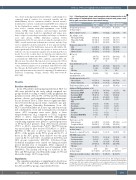
In all, 434 patients undergoing haploidentical HCT for ALL were included in the study, which comprised two groups divided according to which GvHD prophylaxis the patients received: ATG (n=98) or PTCy (n=336). Baseline patient-, disease- and transplantation-related characteris- tics are shown in Table 1. There were no significant differ- ences between the groups in terms of patients’ age, gen- der, ALL subtype, Karnofsky Performance Score <90, HCT-Comorbidity Index ≥3, donors’ age and donor-recip- ient combinations of sex and cytomegalovirus serological status. ATG recipients were more likely to have relapsed/refractory ALL compared to PTCy recipients (30.6% vs. 16.4%, respectively; P=0.008). Although the difference was not statistically significant, myeloablative conditioning regimens were given to a greater proportion of PTCy-treated patients than ATG-treated patients (78.3% vs. 69.4%, respectively; P=0.07). The PTCy group was more likely to have received TBI (45.2% vs. 26.5%; P≤0.001). A TBI dose of ≥10 Gy was administered to 25.8% of the patients in the PTCy group and 14.3% of those in the ATG group. Bone marrow was the graft source in 52.1% and 31.6% of patients in the PTCy and ATG groups, respectively (P≤0.001). ATG-based hap- loidentical transplants were carried out during an earlier period (median year of transplant, 2011) compared to PTCy-based transplants (median year of transplant, 2015) (P≤0.0001). The median follow-up for survivors in the ATG and PTCy groups was 55 months (range, 14-79) and 22 months (range, 12-37), respectively.
Table 1. Baseline patient-, donor- and transplant-related characteristics in the entire cohort of haploidentical donor transplant recipients and groups strati- fied by graft-versus-host disease prevention strategy.
Baseline variable
Recipients’age in years, median (range)
Male recipient*, n (%)
ALL subtype, n (%) Ph-negative B-ALL Ph-positive B-ALL T-ALL
Remission status, n (%) CR1
CR2 or beyond
Advanced (r/r)
KPS, n (%) ≥90 <90
Missing
All patients N = 434 35.6 (18-76)
274(63)
154 (35.4) 140 (32.3) 140 (32.3)
208 (47.9) 141 (32.5) 85 (19.6)
293 (72) 114 (28) 27
188 (79) 50 (21) 196
21 (4.8)
331 (76.3)
103 (23.7) 178 (41)
By GvHD prophylaxis
ATG, N=98
35.5 (18-76)
61 (62.2)
34 (34.7) 36 (36.7) 28 (28.6)
41 (41.8) 27 (27.6) 30 (30.6)
64 (65.3) 23 (23.5) 11
27 (71.1) 11 (28.9) 60
5 (5)
68 (69.4)
30 (30.6) 26 (26.5)
14 (14.9) 4 (4.3) 3 (3.2) 21 (22.3) 40 (42.5)
6 (6.4) 1 (1.1) 1 (1.1) 0
1 (1.1) 3 (3.2) 4
31 (31.6) 67 (68.4)
43.4 (18-74)
30 (30.6)
19 (20.2) 9 (9.6) 12 (12.8) 54 (57.5) 4
2011 (2007-2017)
55 (14-79)
PTCy, N=336 P-value 36 (18-73) 0.93
213 (63.8) 0.78
120 (35.7) 0.51 104 (31.0)
112 (33.3)
167 (49.7) 114 (33.9) 55 (16.4)
0.008
Comorbidity Index, n (%) ≤2
229 (68.2) 0.71 91 (27.0)
16
161 (80.5) 0.19 39 (19.5)
136
16 (4.8) 0.8
263 (78.3) 0.07
≥3 Missing
Prior autologous transplantation, n (%)
Conditioning intensity, n (%) Myeloablative
Reduced intensity
Total body irradiation, n (%)
73 (21.7) 152 (45.2)
<0.001
Additional GvHD prophylaxis, n (%)
Cyclosporine/MTX Cyclosporine/MMF Tacrolimus/MMF Sirolimus/MMF Cyclosporine/MMF/ MTX
Cyclosporine Tacrolimus Tacrolimus/sirolimus MMF
Sirolimus Tacrolimus/MMF/MTX Missing
Graft source, n (%) Bone marrow Peripheral blood
Donors’ age in years,
23 (5.4) 205 (47.3) 88 (20.6) 29 (6.8) 45 (10.5)
16 (3.8) 10 (2.3) 4 (0.9) 3 (0.7) 1 (0.2) 3 (0.7) 7
206 (47.5) 228 (52.5)
40.2 (8-74)
122 (28.2)
57 (13.5) 39 (9.3) 59 (14) 266 (63.2) 13
2015 (2007-2017)
24.4 (12-40)
9 (2.7) NA 201 (59.8)
85 (25.5) 8 (2.4) 5 (1.5)
10 (3) 9 (2.7) 3 (0.9) 3 (0.9) 0
0
3
175 (52.1) 161 (47.9)
<0.001
Female D → male R*, n (%)
D7R CMV status, n (%) Negative/negative Positive/negative Negative/positive Positive/positive Missing
Year of transplant, median (range)
Follow-up in months, median
(range)
39.7 (8-74) 0.38
92 (27.5) 0.55
38 (11.6) 0.19 30 (9.2)
median (range)
47 (14.4) 212 (64.8) 9
2015 (2008-2017)1
22 (12-37)
<0.000
Engraftment
*Data on sex missing for two patients. GvHD: graft-versus-host disease; ATG: anti-thymocyte globu- lin; PTCy: post-transplant cyclophosphamide; ALL: acute lymphoblastic leukemia; Ph: Philadelphia chromosome; CR1: first complete remission; CR2: second complete remission; r/r: relapsed/refrac- tory; KPS: Karnofsky Performance Score; MTX: methotrexate; MMF: mycophenolate mofetil; NA: not available; D: donor; R: recipient; CMV: cytomegalovirus.
The cumulative incidence of engraftment at day 60 was 91.7% (95% CI: 83.7-95.8) and 92.5% (95% CI: 89-95) in the ATG and PTCy groups, respectively (P=0.11).
haematologica | 2021; 106(6)
1593
