
Page 92 - 2021_06-Haematologica-web
P. 92
A. Nagler et al.
Acute and chronic graft-versus-host disease
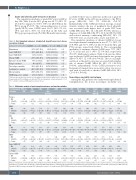
The cumulative incidence of grade II-IV acute GvHD at day 100 (Table 2) in the ATG group was 32.7% (95% CI: 23.4-42.3) compared to 30.5% (95% CI: 25.5-35.6) in the PTCy group (P=0.37). The corresponding rates of severe (grades III-IV) acute GVHD were 11.6% (95% CI: 6.1- 18.9) and 14.1% (95% CI: 10.6-18.2) in the ATG and PTCy groups respectively (P=0.56). On multivariate analy-
Table 2. Post-transplant outcomes (unadjusted) by graft-versus-host disease prevention strategy.
sis (Table 3) there was no difference in the risk of grade II- IV acute GVHD in the ATG group relative to the PTCy group (HR=0.92, 95% CI: 0.55-1.51; P=0.73). Independently of the GvHD prevention strategy, on mul- tivariate analysis, the use of peripheral blood allografts was associated with higher rates of grade II-IV acute GvHD (HR=1.64, 95% CI: 1.06-2.53; P=0.03), whereas a diagnosis of T-ALL (HR=0.52, 95% CI: 0.32-0.85; P=0.008) and reduced intensity conditioning (HR=0.57, 95% CI: 0.34-0.97) were associated with a lower risk (Table 3).
The cumulative incidence of chronic GvHD at 2 years after haploidentical transplantation was 27.7% (95% CI: 17.8-38.5) and 31.7% (95% CI: 26.1-37.4) in the ATG and PTCy groups, respectively (Table 2). The corresponding incidences of extensive chronic GvHD were 7.8% (95% CI: 3.1-15.2) and 12.1% (95% CI: 8.4-16.5), respectively (P=0.37). Multivariate analysis (Table 3) showed no differ- ence in chronic GvHD outcomes between the two groups (HR=0.79, 95% CI: 0.38-1.64; P=0.52). The use of periph- eral blood as the graft source was associated with a higher risk of chronic GvHD (HR=1.82, 95% CI: 1.03-3.23; P=0.04), independently of the GvHD prevention used. Recipient cytomegalovirus seropositive status was associ- ated with a lower risk of chronic GvHD (HR=0.52, 95% CI: 0.3-0.9; P=0.02).
Non-relapse mortality and relapse
Among the ALL patients who underwent haploidentical transplantation, the 2-year non-relapse mortality was
KPS RIC vs. PB vs. Female CMV CMV TBI vs. Center ≥90 MAC BM (D)→ (R)+ (D)– chemo
male (R)
Post-transplant outcomes*
Engraftment
Acute GvHD II-IV
Acute GvHD III-IV
Chronic GvHD
Extensive chronic GvHD
Relapse incidence
Non-relapse mortality
Leukemia free survival
Overall survival
GvHD/relapse-free survival
ATG (95% CI)
91.7% (83.7-95.8)
32.7% (23.4-42.3)
11.6% (6.1-18.9)
27.7% (17.8-38.5)
7.8% (3.1-15.2)
43% (32-53.5)
32.9% (23.1-43.1)
24.1% (14.5-33.8)
27.4% (17.4-37.3)
20% (10.9-29.1)
PTCy (95% CI)
92.5% (89-95)
P-value 0.11
*All outcomes are at 2 years except for acute graft-versus-host disease which is at 100 days after transplantation. ATG: anti-thymocyte globulin; PTCy: post-transplant cyclophosphamide; 95% CI: 95% confidence interval; GvHD: graft-versus-host disease.
Table 3. Multivariate analysis of post-transplant outcomes and baseline variables.
30.5% (25.5-35.6) 0.37 14.1% (10.6-18.2) 0.56 31.7% (26.1-37.4) 0.58 12.1% (8.4-16.5) 0.37
33.8% (28.1-39.5)
26.7% (21.8-31.8) 0.23
0.11
39.6% (33.6-45.5)
48.4% (42.3-54.6)
0.007 0.001
31.8% (26.2-37.5) 0.04
+ Post-transplant PTCy vs. Ph T-ALL
outcomes ATG B-ALL
Age
(per 10 years)
≥CR2
Advanced
Relapse
HR 0.61 0.66 1.05 0.97 2.06 4.99 0.98 1.08 0.971 0.84 1.14 0.92 0.97
(95% CI) (0.39-0.94) (0.39-1.12) (0.69-1.6) (0.83-1.14) (1.32-3.21) (3.13-7.93) (0.65-1.48) (0.67-1.74) (0.66-1.44) (0.56-1.27) (0.70-1.87) (0.59-1.43) (0.67-1.42) P-value 0.03 0.12 0.81 0.72 0.001 <10-5 0.93 0.74 0.88 0.42 0.59 0.7 0.88 0.39
NRM
HR 0.68 1.26 1.04 1.1 1.71 1.82 0.46 0.97 1.48 0.76 0.90 1.33 0.59 (95% CI) (0.42-1.11) (0.76-2.1) (0.62-1.74) (0.94-1.3) (1.07-2.72) (1.02-3.24) (0.30-0.7) (0.59-1.6) (0.97-2.26) (0.47-1.22) (0.53-1.55) (0.8-2.23) (0.38-0.92)
P-value 0.12 0.37 0.88 0.24 0.02 0.04 0.0003 0.91 0.07 0.25 0.71 0.27 0.02 0.43
LFS
HR 0.67 0.94 1.06 1.04 1.91 3.35 0.68 1.06 1.06 0.8 0.95 1.11 0.79
(95% CI) (0.46-0.97) (0.63-1.35) (0.76-1.5) (0.93-1.17) (1.37-2.66) (2.3-4.88) (0.5-0.93) (0.74-1.52) (0.76-1.46) (0.58-1.1) (0.65-1.39) (0.78-1.57) (0.58-1.07) P-value 0.03 0.69 0.72 0.48 0.0001 <10-5 0.01 0.75 0.75 0.16 0.81 0.56 0.13 0.16
OS
HR 0.6 0.92 1.06 1.07 1.88 3.13 0.61 0.96 1.29 0.75 1.07 1.17 0.78
(95% CI) (0.42-0.84) (0.63-1.35) (0.75-1.49) (0.95-1.2) (1.33-2.64) (2.15-4.55) (0.45-0.827) (0.68-1.38)(0.96-1.75)(0.54-1.04) (0.73-1.58) (0.82-1.66) (0.58-1.06) P-value 0.003 0.67 0.75 0.26 0.0003 <10-5 0.001 0.84 0.09 0.08 0.73 0.4 0.12 0.91
GRFS
HR 0.79 0.88 1 1 1.42 2.45 0.77 0.94 1.18 0.97 1.05 1.08 0.87
(95% CI) (0.57-1.11) (0.62-1.24) (0.72-1.35) (0.90-1.11) (1.05-1.92) (1.73-3.47) (0.58-1.02) (0.68-1.31) (0.89-1.57) (0.73-1.31) (0.75-1.49) (0.79-1.49) (0.66-1.15) P-value 0.17 0.47 0.94 0.96 0.02 <10-5 0.07 0.71 0.26 0.85 0.77 0.63 0.34 0.24
Acute GvHD II-IV
HR 0.92 1.09 0.52 0.86 0.98 1.71 1.15 0.57 1.64 1.36 1.11 1.29 1.26
(95% CI) (0.55-1.51) (0.68-1.77) (0.32-0.85) (0.73-1.01) (0.63-1.54) (0.98-2.99) (0.73-1.81) (0.34-0.97) (1.06-2.53) (0.9-2.06) (0.64-1.94) (0.78-2.15) (0.83-1.92) P-value 0.73 0.72 0.008 0.06 0.94 0.06 0.55 0.04 0.03 0.14 0.72 0.32 0.28 0.12
chronic GvHD
HR 0.79 0.83 0.63 0.89 0.95 0.77 0.69 0.65 1.82 1.26 0.52 1.11 0.93
(95% CI) (0.38-1.64) (0.45-1.53) (0.35-1.16) (0.74-1.07) (0.56-1.6) (0.35-1.68) (0.41-1.17) (0.33-1.26) (1.03-3.23) (0.77-2.07) (0.3-0.9) (0.63-1.97) (0.54-1.58) P-value 0.52 0.55 0.14 0.22 0.83 0.51 0.17 0.20 0.04 0.35 0.02 0.71 0.77 0.02
PTCy: post-transplant cyclophosphamide; ATG: anti-thymocyte globulin; Ph: Philadelphia chromosome; ALL: acute lymphoblastic leukemia; ≥CR2: second complete remission or beyond; KPS: Karnofsky Performance Score; RIC: reduced intensity conditioning; MAC: myeloablative conditioning; PB: peripheral blood graft; BM: bone marrow graft; D: donor; R: recipient; CMV: cytomegalovirus; TBI: total body irradiation; NRM: non-relapse mortality; LFS: leukemia-free survival; OS: overall survival; GRFS: GvHD-free/relapse-free survival; GvHD: graft-versus-host disease.
1594
haematologica | 2021; 106(6)
