
Page 239 - 2021_06-Haematologica-web
P. 239
Letters to the Editor
splenectomy accelerates iron loading in the pituitary gland as previously reported to occur in the myocardium.8 To assess for a possible confounding effect of older age (mean 31±6 and 21±6 years in splenec- tomized versus non-splenectomized patients, respective- ly) a multivariable general linear model predicting Z(V) was constructed. It showed that splenectomy was signif- icant while age was not (P=0.002 and P=0.218, respec- tively).
Patients in the third decade of age had significantly higher pituitary iron accumulation than those in their sec- ond decade (Z(R2) 4.9±3 vs. 1.1±2, P<0.002), paralleled by a decrease in pituitary volume, most apparent in the fourth decade of life (Online Supplementary Figure S1). These findings appear to be a decade later than in a prior study.4 It is possible that this difference is the conse- quence of improved adherence to treatment or greater efficacy of the oral chelation drug, deferasirox, used for extended periods by most of our patients. Indeed, two studies have shown stabilization of pre-existing hypogo- nadism, and a low rate of new endocrine disorders with long-term (5 and 6.5 years) chelation with deferasirox.9,10 However, further longitudinal study is needed to assess the effect of chelation regimens on pituitary iron.
Pituitary MRI findings in the 12 control patients were consistent with the published reference data used in this study.
The levels of gonadotropins (LH and FSH) were inversely correlated with pituitary iron load, Z(R2), and directly correlated with anterior pituitary volume, Z(V); LH/FSH levels declined with gland shrinkage (Online Supplementary Figure S2). Ten of 24 post-pubertal women reported regular menstrual periods (group I) and 14 had primary or secondary amenorrhea (group II). LH and FSH concentrations were normal in group I and significantly lower in group II (P<0.04 and P<0.005, respectively). Pituitary iron load and pituitary volume also differed sig- nificantly between the two groups (P<0.03 and P<0.006, respectively)(Figure 1B). These findings suggest low reproductive potential among women in group II, as also indicated by low AMH levels (Table 2), signifying com- promised oocyte count6 and diminished reproductive potential. AMH, a key marker of ovarian reserve, has been reported to be positively associated with pregnancy and live birth rates after assisted reproduction. Its validity in TDT women was demonstrated and it serves as a prognostic factor for the probability of pregnancy when gonadotropin secretion is compromised.11,12
Men who received testosterone supplementation (group II) had lower LH and FSH levels compared to men who did not (group I); P<0.03 and P<0.001, respectively. Although testosterone treatment could contribute to the low levels, our findings indicate that the main causes are pituitary iron toxicity and volume loss since Z(R2) and Z(V) differed significantly between the two groups (P<0.02 and P<0.0002, respectively). Such low FSH lev- els, as observed in group II (1.3 mIU), are associated with low spermatogenesis as also shown in thalassemic men with severe iron overload.13 Furthermore, the levels of inhibin B, a sensitive marker for male infertility, differed significantly between these two cohorts (P<0.03) and were lower than the reported mean level in men with normal fertility parameters. The concentration of inhibin B was below the 10th percentile in 8/26 men (31%), in a range that considerably decreases the likelihood of retrieving testicular spermatozoa.14
Cardiac iron, in addition to strongly correlating with pituitary iron, had an optimal cutoff for predicting a pitu- itary iron threshold associated with reduced volume and
loss of function; area under the curve (AUC) = 0.96, P=0.009 (Figure 1C). The close association between car- diac and pituitary iron might be caused by the additional cellular iron uptake through L-type Ca2+ channels.15 Fifteen of 16 patients with a T2* ≤20 ms had a Z(R2) >4.0 while only 5/35 with a T2* >20 ms had a Z(R2) >4.0 (P<0.006). Therefore, adult patients with a T2* <20 ms are at risk of a decline in fertility potential, but assessing fertility markers even before this cardiac T2* threshold is recommended. LIC and ferritin concentration were less predictive of pituitary iron load; the AUC for these were 0.76 and 0.80, respectively, possibly because of the greater variation in liver and plasma iron. We found no correlation of pituitary iron with non-transferrin bound iron or labile plasma iron.
The effect of chelation over time has not been exam- ined before. We conducted a second measurement (n=17) after an interval of 2.6±1 years which demonstrated decreases in systemic iron: LIC by 46±20%, ferritin by 44±21% and cardiac iron by 34±30% in 11, 10 and 12
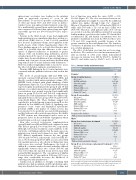
Table 2. Patients’ fertility and hormone data. Characteristics
Females^
Group I: regular menses
Age (years)
LH/FSH (mIU/mL) Estradiol (pg/mL) AMH (ng/mL) Pituitary Z(R2) score Pituitary Z(V) score Cardiac T2* (ms)
Group II: amenorrhea
Age (years)
LH/FSH (mIU/mL) Estradiol (pg/mL) AMH (ng/mL) Pituitary Z(R2) score Pituitary Z(V) score Cardiac T2* (ms)
Pregnancies/live children
With assistant reproductive therapy
Males^
Group I: no testosterone treatment
Age (years)
LH/FSH (mIU/mL) Inhibin B (pg/mL) Testosterone (ng/dL) Pituitary Z(R2) score Pituitary Z(V) score Cardiac T2* (ms)
Father of a child
N (%) or mean (± SD)
24
10 (42%) 20±5 8±7;5±2 84±75 4±3.5 1.3 -1.7 28±7
14 (58%) 31±5 2±2/2.9±3 40±47 1.6± 1 5.1 -2.9 20±9
5/4
2
26
16 (62%) 22±7 3.7±2.7/4.5±2.4 140±69 385±240 2.3
-1. 0 30±7
3
3
With assistant reproductive therapy
Group II: on testosterone replacement treatment 10 (38%)
Age (years)
LH/FSH (mIU/mL) Inhibin B (pg/mL) Pituitary Z(R2) score Pituitary Z(V) score Cardiac T2* (ms)
28 ± 6 1.5±1.8/1.3±1.6 80±55
5.7
-2.7 23±8
^Levels of estradiol and testosterone from patients receiving hormone replacement were excluded from analysis. LH: luteinizing hormone; FSH: follicular-stimulating hormone;AMH:anti-Müllerian hormone.Normal ranges:AMH in fertile women,1.0- 4.0 ng/ml; Inhibin B in adult men, 125-215 pg/mL (both change with age)
haematologica | 2021; 106(6)
1741
