
Page 217 - 2021_06-Haematologica-web
P. 217
Hypoxia signature in BIA-ALCL
sion of CA9 and that CA9 drives BIA-ALCL cell growth under hypoxic conditions.
Hypoxia and CA9 expression drive unique gene signatures in BIA-ALCL cells
We examined the effects of hypoxia and CA9 knock- down on gene expression in BIA-ALCL cells by perform- ing RNA sequencing in TLBR-2 cells, which showed evi- dence of a canonical hypoxia response in the preceding experiments. As anticipated, CA9 mRNA was markedly upregulated under hypoxic conditions and effectively downregulated by CA9 siRNA (both, P<0.0001) (Figure 4A). A heatmap of genes whose expression varied signifi- cantly showed clusters of genes with unique expression patterns as well as clusters of genes with expression pat- terns shared between two of the three conditions (Figure 4B). We used GSEA to explore these findings further (Figure 4C). Notably, the set of genes overexpressed in BIA-ALCL tissue samples as compared with TN non-BIA- ALCL (Figure 1A) was markedly enriched in TLBR-2 cells cultured under hypoxic conditions (NES=2.325; FDR=0.000), providing in vitro validation of the tissue- based finding that BIA-ALCL are characterized by a hypoxia signature. Furthermore, the HALLMARK HYPOXIA gene set identified in BIA-ALCL versus non- BIA-ALCL tissue samples (Figure 1B) was also significant- ly enriched in hypoxic TLBR-2 cells (NES=2.151, FDR=0.000), among other gene sets related to metabolic pathways such as HALLMARK GLYCOLYSIS, REAC- TOME METABOLISM OF CARBOHYDRATES, and REACTOME GLUCOSE METABOLISM (Online Supplementary Table S2). In contrast, siRNA-mediated CA9 knockdown was associated with significant depletion of cell cycle pathways, including REACTOME S PHASE (NES=-2.214; FDR=0.000) as well as MYC target gene sets and multiple other cell cycle-associated gene sets (Online Supplementary Table S3). These findings corroborate previ- ous data showing that CA9 inhibition induced cell cycle arrest in glioblastoma cells, and specifically a marked reduction of cells in S phase.23 We also performed an exploratory analysis comparing RNA sequencing data in TLBR cell lines. Although only TLBR-1 significantly expressed CA9 at baseline, other hypoxia-related genes were relatively overexpressed in TLBR-2 or TLBR-3 (Online Supplementary Figure S5), suggesting heterogeneity that merits investigation in larger future studies.
CA9 overexpression drives BIA-ALCL growth in a xenograft model
We evaluated the effects of CA9 on BIA-ALCL cell
growth further by using a lentiviral system to overexpress
CA9 in TLBR-3 cells, which lack both baseline and hypox-
ia-inducible CA9 expression (Figure 3A). Corroborating
CA9 siRNA data from TLBR-1 and -2 cells, CA9 overex-
pression in TLBR-3 augmented cell growth in vitro (Online
Supplementary Figure S2). We then examined the effect of
CA9 overexpression in a xenograft model. The median
time after inoculation to establishment of palpable subcu-
taneous tumors was 17 days in the CA9 group and 26
days in the control (empty vector-transduced) group
(P=0.004, log-rank test) (Figure 5A). At 38 days, when the
first animal required euthanasia because of tumor size,
tumors were 1,764 ± 1,526 mm3 in the CA9 group and 126
3
± 130 mm in the control group (Figure 5B); differences in
tumor growth were highly significant (P<0.0001, two-
way repeated measure analysis of variance with the Geisser-Greenhouse correction). Using this protocol- defined euthanasia endpoint, median overall survival was 47 days in the CA9 group and 76 days in the control group (P=0.0008, log-rank test) (Figure 5C). Thus, CA9 acceler- ates tumor growth in the TLBR-3 BIA-ALCL xenograft model.
Secreted CA9 in BIA-ALCL cell line models and patients’ samples
Secreted CA9 has been proposed as a biomarker for CA9-expressing malignancies.22,24-26 We therefore evaluated secretion of CA9 into the supernatants of BIA-ALCL cell lines. Secreted CA9 could be detected in culture super- natants of TLBR-1, -2, and -3 cells at concentrations mir-
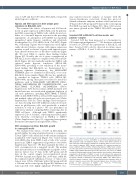
A
B
Figure 3. CA9 expression and growth of breast implant-associated anaplastic large cell lymphoma cell lines. (A) TLBR-1, -2, and -3 breast implant-associated (BIA) anaplastic large cell lymphoma (ALCL) cell lines show distinct patterns of CA9 expression under normoxic and hypoxic conditions. HIF-1α serves as a pos- itive control for hypoxia. TLBR-1 shows constitutive CA9 expression under nor- moxic conditions, which is further enhanced by hypoxia. TLBR-2 lacks constitu- tive CA9 expression but CA9 is induced by hypoxia (canonical hypoxia response). TLBR-3 shows minimal hypoxia-induced CA9 expression. The effects of siRNA- mediated CA9 silencing are shown. Representative data from three independent experiments. (B) Growth of TLBR-1, -2, and -3 cells mirrors CA9 expression. TLBR-1 cells, which constitutively express CA9, show only slight growth induction by hypoxia. Growth is inhibited by CA9 silencing. TLBR-2 cells, which show a canonical hypoxia response, have marked hypoxia-induced growth which is almost completely reversed by CA9 silencing. Hypoxia does not induce either growth or CA9 expression in TLBR-3 cells. *P<0.05; ***P<0.001; ****P<0.0001; n.s., not statistically significant.
haematologica | 2021; 106(6)
1719
