
Page 152 - 2021_06-Haematologica-web
P. 152
M. Xie et al.
A
B
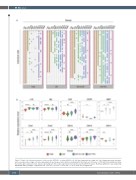
Figure 5. Single-cell real-time-polymerase chain reaction (RT-PCR) of cultured HSC1 cells. (A) Gene expression in a single cell. One column represents one gene, and a row represents a single cell. Gene-expressing cells are shown as dots, which are defined by the threshold cycle (Ct) value < 27.65. (B) Violin density plots show the relative gene expression levels of gene-expressing cells. The relative expression level is defined as the (27.65-Ct) values. Statistical significance was analyzed by ANOVA with Tukey’s multiple comparisons test. *P<0.05; **P<0.01; ***P<0.001; ****P<0.0001; ns: not significant.
1654
haematologica | 2021; 106(6)
