
Page 139 - 2021_06-Haematologica-web
P. 139
miR-146a in NETosis and thrombosis
A
B
C
DE
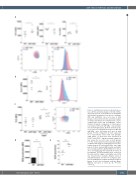
Figure 3. miR-146a determines neutrophil pheno- type. (A) Flow cytometry analysis of CD11b, CD62L, and Cxcr4 (P<0.05 for all markers) on neutrophils (Ly6G-positive population) from blood of wild-type (WT) and miR-146a-/- mice (n=6 mice in both groups). Contour plots from flow cytometry analysis of CD62L and CD11b on neutrophils from a repre- sentative WT mouse and an miR-146a-/- mouse (bottom left panel). Comparison of Cxcr4 expres- sion between WT and miR-146a-/- representative mice (bottom right panel). (B) Flow cytometry analy- sis of Cxcr1 on neutrophils from blood of WT and miR-146a-/- mice (left panel; n=5 mice in both groups; P<0.01). Comparison of Cxcr1 expression on a representative mouse with each genotype (right panel). (C) Tlr4 levels were measured in Cxcr4high and CD62Llow (aged) neutrophil subpopula- tion versus the rest (n=6 mice in both groups; P<0.05). Contour plots from flow cytometry analysis of CD62L and Cxcr4 on peripheral blood pool neu- trophils from six WT and six miR-146a-/- mice (right panel). (D) Bone marrow (BM) isolated neutrophils
DCFDA for 30 min at 37°C and analyzed by flow cytometry (n=3 mice in both groups). (E) BM neutrophils were seeded on the plate and the oxygen consumption rate (OCR) was measured by a Seahorse Analyzer. (mean ± standard deviation, n=3 mice for each group, sam- ples in quadruplicate). Statistical analyses between groups of mice were performed using the Mann- Whitney test (A-C) or t-test (D, E); *P<0.05,
were incubated with 10 mM H **P<0.01.
2
haematologica | 2021; 106(6)
1641
