
Page 66 - 2021_05-Haematologica-web
P. 66
W. Feng et al.
datasets (Online Supplementary Figure S6F). Moreover, upregulation of Pbx3 was observed in HL60 and Kasumi cells overexpressing P2X7 (Online Supplementary Figure S6G). Hence, Pbx3 was selected for further study.
Pbx3 mediates the pro-leukemic effects of P2X7 in MLL-rearranged acute myeloid leukemia
To study the role of Pbx3 in MLL-rearranged AML, MA9-P2X7 cells were infected with pLV-mPbx3-SC or pLV-mPbx3sh1 to construct control and Pbx3 KD AML models (Online Supplementary Figure S7A). The shRNA effectively decreased Pbx3 levels in MA9-P2X7- mPbx3sh1 cells (Online Supplementary Figure S7B). Fewer AML cells were detected in MA9-P2X7-mPbx3sh1 mice,
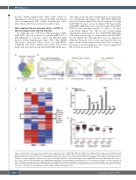
AB
CD
E
Figure 6. Identification of key molecules mediating the pro-leukemic effects of P2X7. MA9, MA9 c-Kit–, MA9 c-Kit+, and MA9-P2X7 cells were sorted, and microarray analysis was performed. (A, B) MA9-P2X7 was normalized to MA9, MA9 c-Kit+ or MA9 c-Kit–. The Venn diagram shows the overlap of differentially expressed genes (DEG) (A), which were subjected to gene set enrichment analysis (B). (C) K-mean clustering shows the 3,329 DEG (aggregate sum of DEG in four populations nor- malized to a quantile algorithm). The gene cluster and selected genes which were expressed at higher levels in MA9-P2X7 cells than in MA9, MA9 c-Kit- or MA9 c- Kit+ cells are shown. (D) Selected genes were validated by quantitative real-time polymerase chain reaction. (E) The correlation between the relative expression of P2X7 and Pbx3 was studied from the GSE10358 (n=304), GSE12417 (n=242) and GSE19577 (n=42) datasets. For each dataset, AML cases were divided into P2X7low and P2X7high groups according to the median value of P2X7, and the relative expression of PBX3 is plotted. Bars represent mean ± standard error of mean. *P<0.05; ***P<0.001; one-way analysis of variance. NES: normalized enrichment score.
especially on day 21, after transplantation of equal num- bers of leukemia cells (Figure 7A). MA9-P2X7-mPbx3sh1 mice had smaller spleens and fewer leukemia cells than MA9-P2X7-SC mice on day 21 (Figure 7B). Importantly, MA9-P2X7-mPbx3sh1 mice survived longer than MA9- P2X7-SC mice (median survival: 34 days vs. 25 days, respectively) (Figure 7C). The in vitro colony-forming experiments demonstrated that MA9-P2X7-mPbx3sh1 cells formed fewer type A colonies than did MA9-P2X7- SC cells (Figure 7D), although there was not a significant difference between total colonies produced by the two types of cells (Online Supplementary Figure S7C). As type A colonies are relatively primitive, these results suggest that KD of Pbx3 decreases LSC levels.
1286
haematologica | 2021; 106(5)
