
Page 38 - 2021_05-Haematologica-web
P. 38
R.Q.H. Kloos et al.
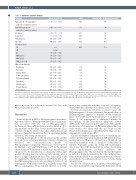
Table 3. Univariate covariate analysis. Covariate
Anti-native E. coli asparaginase antibodies (extinction values)
Anti-PEGasparaginase
antibodies (extinction values) Creatinine
Leukocytes
ICU admission
Infection
Treatment phase
1A
1B
M
MRG intens. MRG maint. SRG protocol IV
Other chemotherapy Prednisone Vincristine Daunorubicine 6-Mercaptopurine Cyclophosphamide Cytarabine Methotrexate Dexamethasone Doxorubicin
Effect: Θ (95% CI) 0.05 (-0.01 – 0.11)
0.04 (-0.01 – 0.10)
-0.21 (-0.36 – -0.07) -0.09 (-0.13 – 0.05) 1.61 (1.55 – 1.67) 1.45 (1.11 – 1.79)
ref
1 (fix)
0.86 (0.78 – 0.94) 0.86 (0.77 – 0.95) 0.78 (0.71 – 0.85) 0.78 (0.67 – 0.88)
1.11 (0.97 – 1.25) 0.89 (0.82 – 0.96) 1.11 (0.97 – 1.25) 0.91 (0.84 – 0.99) 1.13 (0.98 – 1.22) 1.13 (0.93 – 1.33) 0.85 (0.80 – 0.91) 0.85 (0.78 – 0.91) 1.01 (0.90 – 1.12)
DOFV Included after backward elimination? -12.9 No
-7.3 No
-17.0 No -22.9 No -31.0 No -52.5 Yes
-42.3 Yes
-5.4 No -12.2 No -5.4 No -6.8 No -5.3 No -5.3 No -26.2 No -27.7 No -0.06 No
*In order to evaluate any chemotherapy-related effects on clearance on top of the treatment phase,all chemotherapy agents were first included in the multivariate analysis.Only inclusion of doxorubicin and methotrexate resulted in a significant improvement of the model (OFV -6.0, mean effect (RSE): 1.24 (6%) and OFV -10.3, mean effect (RSE): 0.88 (5%), respectively). CI: Confidence Interval; OFV: objective function value; ICU: intensive care unit, MRG intens.: medium risk intensification; MRG maint.: medium risk mainte- nance phase. Covariates significantly influenced the clearance in the univariate analysis when the OFV decreased with >3.84 (P<0.05).
infection occurs, it is advised to increase the dose with 38%, if clinically possible.
Discussion
In this study, the popPK of PEGasparaginase were inves- tigated in order to identify patient and clinical characteris- tics associated with the CL of PEGasparaginase. Furthermore, the popPK model was used to develop a dos- ing guideline for the drug. It was shown that the CL is constant during the first 13 days after administration and increases thereafter. In addition, the CL was higher during induction, and during an infection.
During development of the structural model, neither first- and zero-order, nor Michaelis Menten elimination described the concentration-time profile of PEGasparaginase adequately. This has also been reported by Hempel et al.17 and Würthwein et al.20 In the present study, similar to Würthwein et al., the time dependency of CL proved to be described most adequately with a split model, showing that CL increases substantially after a period of approximately 13 days. This induced CL could be explained by the hydrolysis of the PEG moiety from the PEGasparaginase molecule, resulting in native E. coli asparaginase with a linker attached, originally connecting PEG to asparaginase. Thus, CL will increase to a value
more or less comparable with that of native E. coli asparag- inase, which has a half-life of 1.3 days,16 after several days. Several associations between covariates and the PEGasparaginase CL were identified. The metabolism of PEGasparaginase appears to depend on the treatment phase and is influenced by the presence of an infection. Native E. coli asparaginase is eliminated mainly by macrophages of the mononuclear phagocyte system (MPS) in the bone marrow, spleen and liver.21 Although the mechanism of elimination of PEGasparaginase has not been studied, it is likely that this also holds for the PEGylated formulation as other PEGylated drugs are also
eliminated by cells of the MPS.22
CL was the highest during protocol 1A containing vin-
cristine, prednisone and daunorubicin. MR intensification, maintenance and SR protocol IV had lower CL and all con- tained vincristine as well, so an effect of vincristine is unlikely. Especially as the CL during MR maintenance was lower than MR intensification, either doxorubicin and/or methotrexate probably influence the PEGasparaginase CL. The fact that the CL was the highest in induction might be caused by the other anthracycline, daunorubicin, which was administered weekly, whereas doxorubicin, was administered once every 3 weeks during intensification.
Besides the administration of specific chemotherapeu- tics, other mechanisms may explain the differences in CL
1258
haematologica | 2021; 106(5)
