
Page 39 - 2021_05-Haematologica-web
P. 39
Individualized PEGasparaginase dosing guideline
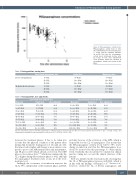
Figure 2. PEGasparaginase activity levels.
PEGasparaginase activity levels vs. time after administration for the index database (●, n=92) and the validation database (●, n=28). Note that the asparaginase activity levels nonlinearly decline after 12.7 days. Of note, dose adjustments could (partially) explain the variation in asparaginase activity levels shown in this figure.
Table 4. Dosing guideline, starting dose.
Target trough asparaginase level
Loading dose
800 IU/m2 1,800 IU/m2 2,200 IU/m2 600 IU/m2 1,500 IU/m2 1,800 IU/m2
Target trough level: 250-400 IU/L
Maintenance dose
600 IU/m2 1,400 IU/m2 1,600 IU/m2 400 IU/m2 1,000 IU/m2 1,800 IU/m2
Protocol 1A (induction)
Medium risk intensification
100 IU/L 250 IU/L 350 IU/L 100 IU/L 250 IU/L 350 IU/L
Table 5. Dosing guideline, dose adjustments.
arget trough level: 100-250 IU/L
Week level
50-100 IU/L
100-250 IU/L 150-200 IU/L 200-450 IU/L 450-550 IU/L 550-750 IU/L 750-1,100 IU/L 1100-1,500 IU/L
1500-1,800 IU/L
Trough level
25-50 IU/L
50-75 IU/L 75-100 IU/L 100-250 IU/L 250-300 IU/L 300-400 IU/L 400-600 IU/L 600-800 IU/L
800-1,000 IU/L
Dose adjustment
400%
300% 200% 100% 60% 50% 40% 25%
20%
Week level
100-200 IU/L
200-300 IU/L
300-250 IU/L
350-450 IU/L
450-700 IU/L
700-900 IU/L
900-1,100 IU/L
1100-1,250 IU/L
1250-1,800 IU/L
Trough level
50-100 IU/L
100-150 IU/L
150-200 IU/L
200-250 IU/L
250-400 IU/L
400-500 IU/L
500-600 IU/L
600-700 IU/L
700-1,000 IU/L
Dose adjustment
400%
300%
200%
175%
100%
70%
60%
50%
35%
The dose adjustments apply for biweekly administration of PEGasparaginase during steady state.The doses may be adjusted based 1 week (7 days) or trough (14 days) after administration targeting at trough asparaginase activity levels of 100-250 IU/L or 250-400 IU/L.
between the treatment phases. It has to be taken into account that the physical condition of the patient alters during ALL treatment: during protocol 1A (and also 1B), the tumor load is higher and therapy is more intense com- pared to protocol M, MR intensification and maintenance, and SR protocol IV, which all had a lower CL. The MPS plays a role in tumor lysis,23,24 which may explain why the CL is higher during this treatment phase as well, although the asparaginase treatment starts at day 12 of the treat- ment protocol.
Strikingly, the occurrence of an infection increases the CL by 38%, independent of the treatment phase and BSA,
probably because of the activation of the MPS, which is responsible for the CL of asparaginase. This means that the PEGasparaginase activity levels will be 38% lower during an infection and that the PEGasparaginase dose should be increased by this percentage to obtain similar levels. Evidently, this should first be validated in clinical practice, taking into account the clinical situation of the patient.
BSA was included in the structural model, showing that the CL of PEGasparaginase increases with BSA, which is in line with the findings of Hempel et al.17 Sassen et al., however, studied the CL of Erwinia asparaginase and
haematologica | 2021; 106(5)
1259
