
Page 36 - 2021_05-Haematologica-web
P. 36
R.Q.H. Kloos et al.
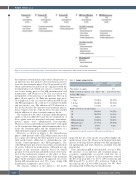
Figure 1. Concomitant chemotherapy. Types of chemotherapy for each treatment phase. MR: medium risk; SR: standard risk.
the stepwise forward inclusion procedure, the presence of an infection was first added to the structural model, fol- lowed by the treatment phase. The CL increased by 38% when a patient had an infection. In comparison with the treatment phase 1A, which was used as a reference, CL was lower during protocol M, MR intensification and maintenance, and SR protocol IV. This association was independent of the presence of an infection. The CL in phase 1B was equal to 1A. Only two patients were treat- ed as high risk, so the association between the HR blocks and PEGasparaginase CL could not be estimated reliably and was fixed to one. The addition of ICU admission to the model (besides the infection and treatment phase), did not improve the fit of the model to the data, neither did the addition of other covariates improve the fit.
The evaluation of the effect of specific chemotherapeutic agents on CL was difficult because blood concentrations of those agents were not measured and many chemothera- peutics agents were administrated concomitantly. Therefore, it was assumed that a possible effect of the agent on CL was present during the entire treatment phase. As a result, the treatment phase and the administration of a chemotherapeutic agent were highly correlated.
However, as shown in Figure 1, the intensification phase of MR patients with a TEL/AML1 translocation did not contain doxorubicin but these patients were treated with methotrexate additional to dexamethasone, vin- cristine, 6-mercaptopurine and PEGasparaginase. The other MR patients first received four times doxorubicin in 12 weeks, followed by methotrexate. Although not sig- nificant in the univariate analysis, based on clinical grounds, both doxorubicin and methotrexate were evalu- ated in the multivariate analysis as the effect of these drugs could be analyzed independently of the treatment phase. In the univariate analysis, CL appeared 11% lower during MR intensification and 19% lower during MR maintenance compared to protocol 1A.
The separate addition of the agents to the model
Table 1. Sample characteristics.
Index dataset
Validation dataset n=28
405
6(2–33)(1–39)
181 (45%) 187 (46%) 37 (9%)
68 (17%) 39 (10%) 19 (5%) 94 (23%) 177 (43%) 8 (2%) -
Total number of samples
n=92
816
Numberoflevelsperpatient, 3(2–12)(1–38)
median (IQR) (range) Sample time (%)
0-7 days 8-14 days > 14 days
371 (45%) 342 (42%) 103 (13%)
Number of levels per treatment phase
1A
1B
M
MR intensification MR maintenance SR protocol IV
HR blocks
144 (18%) 142 (17%) 69 (8%) 168 (21%) 250 (30%) 38 (5%) 5 (1%)
IQR: interquartile range; SR: standard risk; MR: medium risk; HR: high risk.
improved the fit of the model (doxorubicin higher CL, methotrexate lower CL). However, in the backward elim- ination, both drugs did not influence the PEGasparaginase CL significantly and were, therefore, excluded from the final model.
Thus, the final popPK model included, on top of BSA, the presence of an infection and treatment phase, as covariates significantly associated with the CL of PEGasparaginase. Inclusion of these parameters reduced the IIV of CL from 24.1% to 19.7% (18% reduction), and IOV from 25.7% to 23.6% (8% reduction) (Table 2). In this final model, CL was 0.084 L/day/m2 for 12.7 days, increasing with 0.082 L/day/m2/day thereafter.
1256
haematologica | 2021; 106(5)
