
Page 266 - 2021_05-Haematologica-web
P. 266
Letters to the Editor
Additionally, the bona fide mesenchymal stem cell marker, PDGFRα+Sca1+(PaS), and adipocyte primed lep- tin receptor (LepR)13 were also analyzed. The frequency of these markers in leukemia bone stromal cells was sig- nificantly increased in a disease-burden-dependent man- ner (Online Supplementary Figure S2A and B). These data suggest that the leukemia-induced exhaustion of stroma and terminally differentiated adipocytes and osteoblasts pushes the mesenchymal stem cells or preadipocytes to expand to meet the renewed demands to sustain normal hematopoiesis or to support leukemia propagation, but that they fail to differentiate fully. Collectively, these data suggest that cancer-induced microenvironmental repro- gramming could be a common feature of acute leukemias despite the genetic heterogeneity of these malignancies.
To gain insights into the molecular mechanisms under- lying the reduction of adipocytes in leukemia, we ana- lyzed the expression of genes involved in the pathway of triglyceride hydrolysis, ATGL (also known as PNPLA2) and hormone-sensitive lipase (HSL or LIPE, Ser563 phosphorylation site) in leukemic conditions.14 The adipocytes co-cultured with leukemic cells through a transwell for 24 h (in vitro) and white adipose tissue from leukemic mice (in vivo) exhibited upregulation of ATGL and HSL Ser563 protein expression compared to the respective controls (Figure 2A-D).
Next, to identify the driver behind this leukemia-medi- ated upregulation of ATGL and HSL, we analyzed leukemia exosomes. The exosomes used in the study were validated using standard markers (Online
Supplementary Figure S2C-E). When co-cultured with adipocytes, the leukemia exosomes enhanced adipocyte- specific ATGL and phosphorylated HSL (Ser563) protein levels unlike their normal exosome counterparts (Figure 2E), initiating the lipolysis cascade, suggesting cargo-spe- cific differences between leukemic and normal BM exo- somes. Next, we observed a significant upregulation of ATGL in white adipose tissue from leukemic mice (Figure 2F) and significantly reduced levels of a lipid droplet- associated protein, perilipin, in BM plasma, suggesting an inverse correlation between perilipin and ATGL expres- sion (Figure 2G). Single-cell transcriptomics analysis of human BM stroma from ALL patients and healthy con- trols corroborated the leukemia models and in vitro find- ings and showed an upregulation of LIPE and PNPLA2 gene expression in leukemia stromal cells (Figure 2H). Furthermore, evaluating the clinical significance of these genes related to triglyceride catabolism, we analyzed the RNA sequencing data from the published TARGET phase-II ALL study datasets15 and observed that overex- pression of LIPE and PNPL2 genes is associated with infe- rior overall survival in ALL patients (Online Supplementary Figure S2F), highlighting the importance of these genes in leukemia-induced microenvironmental dysregulation.
Extending the working hypothesis that exosome-medi- ated adipose dysfunction favors leukemia growth, we cultured adipocytes with 10 mg of exosomes derived from healthy subjects, leukemia cell lines and an AML patient (COH202) for 24 h. The adipocytes cultured with leukemia exosomes exhibited enhanced levels of inter-
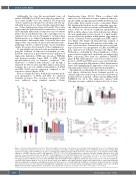
ABC
DEFG
Figure 3. Exosome-induced lipolysis increases fatty acid oxidation in leukemic cells and genetic or pharmacological targeting alone or in combination with chemo-radiotherapy augments leukemia cell apoptosis. (A) Relative intracellular carnitine palmitoyltransferase IA (CPT1A) mean florescence intensity (MFI) expression analysis at 24 h in MV4-11 cells after co-culturing with conditioned media (CM) derived from control adipocytes, acute myeloid leukemia (AML) adipocytes, and AML adipocytes with 50 mM atglistatin; *P<0.05, **P<0.005. (B) Quantification of adipocyte size after culturing adipocytes alone, with leukemic cell exosome-enriched CM, and with CM + 50 mM atglistatin or 200 nM CAY104988 for 48 h; *P<0.05, **P<0.005, ****P<0.0001. (C) BODIPY (493/505) MFI expression in leukemic cells after culturing with prelabeled adipocytes ± atglistatin or CAY104988; *P<0.05, **P<0.005, ***P<0.001. (D) Percentage apoptosis of MV4-11 cells after culture with AML-/adipocyte-CM with or without atglistatin, followed by culture in the presence of 5 nM of quizartinib, a tyrosine kinase inhibitor (TKI) for 72 h; *P<0.05. (E) Percentage of live MV411 cells at 48 h (annexin V–/DAPI–) after radiation and co-culture with non-primed adipocytes, AML-primed adipocytes, and AML-primed adipocytes in the presence of 50 mM atglistatin. (F) MV4-11 cell numbers on different days after culturing alone and in the presence of 50 mM and 100 mM atglistatin. (G) MLL-AF9 cells were transduced with non-targeting scrambled shRNA (control cells) and ATGL shRNA and treated with 1 mM doxycycline. Cell numbers were determined on days 1, 2, 3, and 4; **P<0.005, ***P<0.001, ***P<0.0001.
1486
haematologica | 2021; 106(5)
