
Page 265 - 2021_05-Haematologica-web
P. 265
Letters to the Editor
activated bone marrow-derived receptor gamma (Pparg) mRNA levels were observed in stromal cells (GFP–CD45– Ter119–CD31–) in a leukemia burden-dependent manner in ALL and AML mice (Figure 1B and C) confirming that leukemia progression exhausts mature osteoblasts and adipocytes. Besides reductions in mature niche popula- tions, the frequency of bone stromal cells was also signif- icantly diminished in ALL and AML mice compared to the frequency in control animals (P<0.0001 and P<0.0001, respectively) (Online Supplementary Figure S1B and C) suggesting a progressive inhibition of all BM con- stituents that support functional hematopoiesis with leukemia development.
Considering the loss of BM stroma, osteoblasts and adipocytes, we next investigated the progenitor popula- tions responsible for replenishing these cells. Sca1+CD24+ cells from BM have been shown to differentiate into
osteochondrogenic and adipogenic lineages, unlike adipocyte lineage-restricted Sca1+CD24− progenitors (preadipocytes).12 Flow cytometry analysis of these dis- tinct entities in bone stromal cells revealed that the per- centage of Sca1+CD24+ multipotent progenitors (CD45− Ter119− CD31−CD166− Sca1+CD24+) within mesenchymal stem cells in MLL-AF9− and BCR-ABL+ leukemic mice was significantly reduced compared to that in healthy controls both in transplantation and knock-in leukemia models (P<0.0001 and P=0.0004, respectively (Figure 1D and E; Online Supplementary Figure S1D). Although, the frequen- cy of preadipocytes in Sca1+ mesenchymal stem cells was significantly higher in leukemia mice (Figure 1F), the in vitro differentiation potential of preadipocytes from mice with high BM disease burden (70-85%) was severely compromised, as suggested by reduced Pparg mRNA lev- els (Figure 1G) and BODIPY staining (Figure 1H).
ABCD
EFG
HIJK
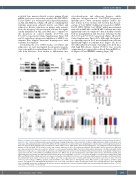
Figure 2. Leukemic cells enhance the expression of lipolytic enzymes through their secreted exosomes, creating an inflammatory microenvironment that pro- motes the cells’ survival. (A) Representative western blot image showing upregulation of the expression of adipose triglyceride lipase (ATGL) and hormone-sen- sitive lipase (HSL) phosphorylated at serine 563 (pHSL) (S563) in adipocytes co-cultured with acute lymphoblastic leukemia (ALL) cells through transwell insert plates for 24 h. (B) ATGL and pHSL (S563) immunoblot of white adipose tissue (WAT) lysates from normal and ALL mice. (C) Combined normalized expression analysis of ATGL and pHSL (S563) between control and leukemic adipocytes in vitro. (D) Combined normalized ATGL and pHSL (S563) expression in WAT from age- and sex-matched normal mice and mice with ALL or acute myeloid leukemia (AML) from three independent experiments. (E) ATGL and pHSL (S563) immunoblot of adipocytes co-cultured with 10 μg normal cells or AML-derived exosomes for 24 h. (F) Enzyme-linked immunosorbent assay (ELISA) of ATGL protein expression levels from control, MV4-11 and NALM6 leukemic mice WAT at day 15 after transplantation. (G) Perilipin protein levels, determined by ELISA, were significantly lower in leukemic mice BM supernatants than in those from control BM; **P<0.01, ***P<0.001. (H) Single-cell sequencing revealing relative LIPE (HSL) and PNPLA2 (ATGL) mRNA expression in leukemia and healthy control BM-sorted stroma cells. (I) Relative mRNA expression analysis of interleukin-1b (IL- 1b), interleukin-6 (IL-6), tumor necrosis factor-α (TNFα), and CCL3 of adipocytes after co-culture with normal and leukemic exosomes for 24 h; *P<0.05, **P<0.01. (J) Percentage of MV4-11 apoptotic (annexin V+DAPI+) cells at 48 h after co-culturing with control, AML exosomes, and exogenous cytokines (IL-1b and IL-6, 100 ng/mL) ± 50 mM atglistatin. (K) Relative levels of free fatty acids (FFA) in culture supernatants at 24 h after culturing adipocytes alone, with AML cells, or with AML in presence of atglistatin. All data are means ± standard error of mean. Statistical significance was determined by unpaired t-tests; *P<0.05, **P<0.01, ***P<0.001, ****P<0.0001.
haematologica | 2021; 106(5)
1485
