
Page 264 - 2021_05-Haematologica-web
P. 264
Letters to the Editor
Exosome-driven lipolysis and bone marrow niche
remodeling support leukemia expansion
Since the bone marrow (BM) microenvironment and adipose tissue provide an attractive sanctuary for cancer progression and the acquisition of drug resistance pheno- types,1-5 interactions between BM niche components and leukemia have recently attracted interest. However, the mechanisms underlying these complex interactions are not well understood. We previously reported that leukemic cells. through their secreted exosomes, induce microenvironment reprogramming to inhibit normal hematopoiesis and create a self-enforcing microenviron- ment for their own expansion.6 Here, using syngeneic acute myeloid leukemia (AML)/acute lymphoblastic leukemia (ALL) transplantation and knock-in leukemic mice models, we aimed to understand how leukemia remodels the BM niche. We describe a novel mechanism through which leukemic cells, via their exosomes,
remodel BM niche subpopulations by enhancing the expression of adipose triglyceride lipase (ATGL) and hor- mone-sensitive lipase (HSL) enzymes in adipocytes, resulting in increased lipolysis. Furthermore, pharmaco- logical inhibition of ATGL and HSL rescued lipolysis, pre- served adipocyte morphology and reduced fatty acid oxi- dation in leukemic cells. Finally, we show that leukemia progression can be delayed by increasing osteoblasts and adipocytes in vivo.
As mesenchymal stem cells, osteoblasts and adipocytes together with other bone stromal cells influence hematopoietic stem cell homeostasis, regeneration and leukemic progression,7-11 we investigated these popula- tions during leukemogenesis. As found previously,6 histo- logical analysis of normal and leukemic mice bones revealed a reduction in mature osteoblasts and adipocyte numbers in both AML and ALL models (Figure 1A, Online Supplementary Figure S1A). Significant, progressive declines of osteocalcin (Ocn) and peroxisome proliferator-
ABC
DEH
FG
1484
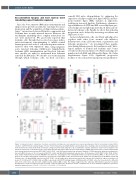
Figure 1. Leukemia leads to exhaustion of mature osteoblasts and adipocytes and expands bone marrow preadipocytes that do not undergo terminal differ- entiation. (A) 5X Trichrome-stained images of bones from normal and acute lymphoblastic leukemia (ALL) mice, showing reduced osteoblasts and adipocytes in the leukemic mice. Red arrows mark osteoblasts, and green arrows mark adipocytes. (B, C) Quantitative real-time polymerase chain reaction analysis of rel- ative gene expression of osteoblast-specific osteocalcin (Ocn) (B) and mature adipocyte-associated Pparg (C) mRNA expression between controls and leukemia bone marrow-derived sorted stroma (GFP-CD45–Ter119–CD31– cells). (D) Representative flow-cytometric analysis of CD24 expression within mesenchymal stro- mal cells (MSC) in bones of 8- to 10-week-old B6/C57 control and MLL-AF9-transplanted leukemic mice. (E) Frequency of GFP–CD45–Ter119–CD31–CD166– Sca1+CD24+ multipotent bone marrow (BM) MSC in normal mice and syngeneic mice transplanted with acute myeloid leukemia (AML) or ALL (n>6 mice per group in at least three independent experiments. (F) Frequency of GFP–CD45–Ter119–CD31–CD166–Sca1+CD24- cells (preadipocytes) in the BM of normal and leukemic mice. (G) Pparg mRNA expression by Sca1+CD24– cells (preadipocytes) derived from normal and leukemic mice primed for adipose induction for 2 weeks (P=0.0085 and P=0.0284, in ALL and AML, respectively). (H) BODIPY staining images of BM-derived Sca1+CD24– cells, after 2 weeks in vitro differenti- ation, from control mice and mice with a high leukemia burden (AML or ALL). The images suggest that the adipocyte differentiation capacity of leukemic preadipocytes is reduced compared to that of normal, control preadipocytes. All data are means ± standard error of mean. Statistical significance was deter- mined by unpaired t-tests; *P<0.05, **P<0.01, ***P<0.001, ****P<0.0001.
haematologica | 2021; 106(5)
