
Page 152 - 2021_05-Haematologica-web
P. 152
A. Bornert et al.
A
BC
D
EF
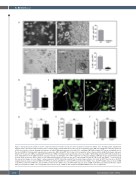
Figure 3. Strong discrepancy between in vitro cultured proplatelet formation and in vivo native proplatelet formation in Tubb1-/- mice. (A) Upper panel, explant bone marrow culture experiment. Representative phase contrast images and quantification of the percent of megakaryocytes (MK) presenting with cultured proplatelets (cPPT) after 6 hours of culture showing total absence of Tubb1-/- MK with protrusions (0%) while 55% of wild-type (WT) MK extended cPPT (mean ± standard error of the mean [SEM], n=3 independent experiments). Lower panel, MK forming PPT after 4 days of Lin– progenitor culture. Representative bright field images and quan- tification of the percent of MK presenting with cPPT (mean ± SEM, n=4 independent experiments). Inset, rare Tubb1-/- MK forming abnormal cPPT without shaft exten- sions. (B) Estimation of the nPPT formation capacity in situ by calculating the ratio of PPT fragments over the total number of MK observed in 30-mm thick marrow sections. Bars are mean ± SEM of three to four independent marrow sections from two mice, representing 374 and 687 MK for WT and Tubb1-/- , respectively. (C) Two z-projection images of in vivo Tubb1-/- native proplatelets (nPPT). Dotted lines delimit the sinusoids. Representative of at least 12 nPPT from five mice. (D) nPPT elongation speed. Data are mean ± SEM of 16 nPPT pooled from eight WT mice and 12 nPPT pooled from four Tubb1-/- mice. (E) nPPT length. Data are mean ± SEM of 25 nPPT pooled from 14 WT mice and 16 nPPT pooled from five Tubb1-/- mice. (F) nPPT width. Data are mean ± SEM of 28 nPPT pooled from 19 WT mice and 16 nPPTs pooled from five Tubb1-/- mice. Bar graphs represent the mean ± SEM; all data analyzed using Mann-Whitney test. ns: not significant.
1372
haematologica | 2021; 106(5)
