
Page 150 - 2021_05-Haematologica-web
P. 150
A. Bornert et al.
A
B
C
D
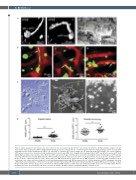
Figure 1. Native proplatelets generated in the bone marrow in vivo are morphologically different from cultured proplatelets. (A) Representative images of in situ bone marrow native proplatelets (nPPT): GPIbβ immunolabeling and confocal observation of a 30 mm-thick bone marrow section showing a portion of a long nPPT extending from the mother megakaryocyte (MK) (*) (i), and detail of a bulbous nPPT end (ii); images are 3D rendering using LASX software. (iii), several elongated nPPT (arrows) observed in a sinusoid vessel by scanning electron microscopy (SEM). Inset, magnification showing a bulbous nPPT end. Note the various nPPT shaft widths. Representative of at least three mice. (B) In vivo nPPT: z-projection images from time-lapse experiments showing the various morphologies of nPPT (arrows) extending within the bone marrow (BM) sinusoids. nPPT and MK are in green, sinusoid vessels are in red. Representative of at least 20 mice. (C) Representative images of in vitro cultured proplatelets (cPPT): cPPT produced by MK differentiated in culture from mouse BM progenitors, visualized by bright field microscopy at the bottom of the culture well before fixation (i) or after paraformaldehyde-fixation and SEM observation (ii); (iii), cultured proplatelets (cPPT) extending in vitro from a BM explant, observed by phase contrast microscopy. (D) Scatter plot representing cPPT shaft and terminal bud widths from explant BM measured on phase contrast images (left) (30-50 cPPT per group, data pooled from two individual BM explants) or nPPT shaft and terminal bud widths from in vivo recordings (right). Mean ± standard error of the mean from 18 to 28 values, pooled from 14 mice. Statistics analyzed using Mann-Whitney comparison test.
1370
haematologica | 2021; 106(5)
