
Page 151 - 2021_05-Haematologica-web
P. 151
In vivo proplatelet formation
b1-tubulin deficiency prevents proplatelet formation in vitro but not in vivo
Among other key cytoskeletal elements, microtubules have been shown to play an essential role in the dynamics of cPPT. In order to determine their role in vivo, we used mice deficient in b1 tubulin (Tubb1-/-), the major b tubulin isoform in platelets. MK from Tubb1-/- mice were unable to
extend protrusions in vitro in a bone marrow explant assay (Figure 3A, upper panel) and only rare abnormally short and compact extensions were observed following in vitro differentiation of bone marrow progenitors (Figure 3A, lower panel inset), confirming previous results in fetal liver-derived MK.33
In situ, examining the Tubb1-/- bone marrow by immuno-
A
B
C
D
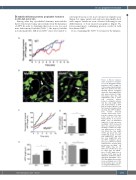
Figure 2. Myosin regulates native proplatelet elongation speed. (A) Normalized native proplatelet (nPPT) length (%) of three independent wild-type (WT) mice plotted over time, showing regular elongation (black line, max length=282.1 μm), pauses between elonga- tion phases (blue line, max length=151.2 mm) or pause and retraction phases between elongation phases (red line, max length =85.6 μm). Representative of nPPT from at least 10 WT mice. (B) Two z-projection images show- ing long, thin nPPT in Myh9-/- bone marrow sinusoids (arrows). Dotted lines repre- sent the contours of the sinu- soids. Scale bar =20 mm. Representative of at least 10 Myh9-/- mice. (C) Normalized length (%) of four representa- tive Myh9-/- nPPT observed in three mice plotted over time, showing a continuous elonga- tion, without pause or retrac- tion (black line, max length =175.1 μm; green line, max length=221.2 mm; red line, max length=132.7 mm; blue line, max length=98.5 mm). (D) nPPT elongation speed. Data are 12 nPPT pooled from
E
F eight WT mice and 12 nPPT pooled from five Myh9-/- . (E) nPPT length. Data are 25 nPPT from 14 WT mice) and 13 nPPT from five Myh9-/- mice. (F) nPPT width close to the base of PPT. Data are 28 nPPT from 19 WT mice and 17 nPPT from eight Myh9-/- - mice. (D-F) Bar graphs represent the mean ± standard error of the mean; P-values were calculat-
ed using Mann-Whitney test.
haematologica | 2021; 106(5)
1371
