
Page 136 - 2021_05-Haematologica-web
P. 136
M. Ackermann et al.
(v3.8, chipstercsc.fi). Differentially regulated genes were called
cell type classification based on The Human Gene Atlas were con- ducted using Enrichr (https://amp.pharm.mssm.edu/Enrichr). Gene set enrichment analysis (GSEA) was performed using GSEA v3.0, Broad Institute.
Culture of OP9 stromal cells
Transgenic OP9 cells expressing Delta-like ligand (DLL) 1 or DLL4 were cultured in α-MEM supplemented with 20% fetal calf
using two group tests (empirical Bayes). Differential expression
thresholds were set to log -fold change ≥1 (upregulated) or ≤1 2
(downregulated) with an adjusted P-value of ≤0.05 (corrected with Benjamini Hochberg equasion).
Heatmap clustering analysis and generation of GO-based heatmaps were performed in Omics Explorer (version 3.4). Gene ontology analysis of biological processes, molecular function and
A
BC
DEF
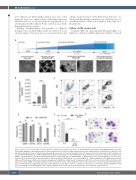
Figure 1. Effect of IL-3 on hematopoietic differentiation of human induced pluripotent stem cells. (A) Schematic representation and brightfield microscopy of dif- ferent stages within the employed hematopoietic differentiation protocol. From left to right: pluripotent stem cells, embryoid bodies, hemanoids (scale bars: 500 mm) and induced pluripotent stem cell (iPSC)-derived macrophages (scale bar: 100 mm). (B) Quantity of total cells harvested from the supernatant of the hemanoids cul- tured in different differentiation conditions (without [w/o] cytokines, with only IL-3 or with IL-3/M-CSF) per week and well (n=9-10, mean ± standard error of the mean [SEM]). (C and D) Analysis of cells harvested from differentiation cultures with only IL-3 and IL-3/M-CSF. (C) Representative flow cytometry analysis of specific surface marker expression (percentage of gated population is indicated) and (D) quantification of n=3, mean±SEM. (E) Colony forming units (CFU) granulocyte/monocyte (GM) and CFU-granulocyte/erythrocyte/monocyte/megakaryocyte (GEMM) or erythroid burst forming unites (BFU-E) of cells harvested from different culture condi- tions (n=3-4, mean±SEM). (F) Cytospin staining of cells harvested from cultures with only IL-3 that were further matured for 1 week in medium with M-CSF (upper row) or G-CSF (lower row), respectively (scale bar: 50 mm and 20 mm, respectively). *P<0.05, **P<0.01, ***P<0.001, ****P<0.0001; statistical significance was assessed using (B) one-way ANOVA with Tukey’s multiple comparison test and (D and E) two-way ANOVA with Sidak's multiple comparisons test.
1356
haematologica | 2021; 106(5)
