
Page 128 - 2021_05-Haematologica-web
P. 128
F. Arruga et al.
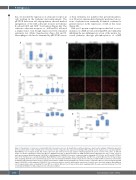
this, we checked the expression of adenosine receptors in cells residing in the leukemic microenvironment. The qRT-PCR data from cell subpopulations showed marked upregulation of the A2A adenosine receptor in leukemic B-cell and CD4+ and CD8+ T-cell subsets (Figure 4A). The other two adenosine receptors, i.e., A2B and A3, followed a similar trend, even though expression levels remained extremely low (Online Supplementary Figure S2A and B). Macrophages could not be examined by qRT-PCR because
of their extremely low numbers that prevented purifica- tion. However, immunohistochemistry performed on sec- tions of spleens from terminally ill animals confirmed a general increase in the expression of A2A in this tissue (Figure 4B).
A2A are G-protein-coupled receptors that lead to accu- mulation of cAMP, in turn activating PKA and ultimately inhibiting the pro-inflammatory action of the nuclear fac- tor-κB pathway through phosphorylation of cAMP
AB
C
D
Figure 4. Upregulation of adenosine-sensing ability with leukemia progression. (A) Quantitative real-time polymerase chain reaction analysis of Adora2a expression in B cells and in CD4+ or CD8+ T lymphocytes of TCL1 mice (n=20) compared to the expression in wild-type (WT) animals (n=20). Statistics were calculated with the Mann-Whitney test for unpaired data. RE: relative expression. (B) Confocal microscopy analysis of A2A upregulation in spleen sections of TCL1 mice at different stages of leukemia engraftment compared to WT mice. Magnification 63X. (C) Phosflow analysis of CREB phosphorylation in B-lymphocytes (top) or CD8+ cells (bot- tom) upon treatment with A2A agonist CGS21680 or A2A antagonist SCH58261. Data were compared between terminally ill TCL1 mice (n=13) and WT C57BL/6 mice (n=6). Statistics were calculated using the Mann-Whitney test for unpaired data, when comparing TCL1 and WT mice, and the Wilcoxon test for paired data, when analyzing, within the same experimental group, the effect of stimulation/inhibition of A2A compared to the untreated condition. MFI: mean fluorescent intensity. (D) Enzyme-linked immunosorbent assay to evaluate protein kinase A (PKA) activity in B-lymphocytes from TCL1 mice compared to WT mice upon treatment with A2A agonist CGS21680 or A2A antagonist SCH58261. The results presented are from five independent experiments. Statistics were calculated using the Mann-Whitney test for unpaired data, when comparing TCL1 and WT mice, and the Wilcoxon test for paired data, when analyzing, within the same experimental group, the effect of stimulation/inhibition of A2A compared to the untreated condition.
1348
haematologica | 2021; 106(5)
