
Page 126 - 2021_05-Haematologica-web
P. 126
F. Arruga et al.
A
B
C
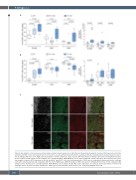
Figure 2. Upregulation of adenosine-generating enzymes during leukemia progression. (A) Left panel. Flow cytometry analysis of surface CD39 expression on B cells, and CD4+ and CD8+ T cells collected from spleens of TCL1 mice at early and late time-points (n=20, each time-point) after leukemia injection and compared to expres- sion in wild-type (WT) mice (n=7). Right panel. Quantitative real-time polymerase chain reaction (qRT-PCR) analysis of Entpd1 expression in terminally ill TCL1 mice (n=20) compared to WT animals (n=20). Statistics were calculated with the Mann-Whitney test for unpaired data. RE: relative expression. (B) Left panel. Flow cytom- etry analysis of surface CD73 expression on B cells, and CD4+ and CD8+ T cells collected from spleens of TCL1 mice at early and late time points (n=20, each time point) after leukemia injection and compared to WT mice (n=7). Right panel. qRT-PCR analysis of Nt5e expression in terminally ill TCL1 mice (n=20) compared to WT animals (n=20). Statistics were calculated with the Mann-Whitney test for unpaired data. RE: relative expression. (C) Confocal microscopy analysis of CD73 (red) staining in spleen sections from TCL1 and WT mice. B220 (green) and CD3 (white) mark B and T cells, respectively. Magnification 63X.
1346
haematologica | 2021; 106(5)
