
Page 125 - 2021_05-Haematologica-web
P. 125
Targeting A2A in CLL
A
B
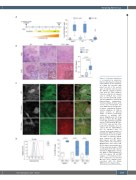
Figure 1. Leukemia engraftment is accompanied by progressive hypoxia. (A) Left panel: schematic
C representation of the experimen- tal setting and schedule; right panel: box plot of the percent- ages of leukemic cells traced in the different engrafted districts early and late after intraperi- toneal (i.p.) injection of leukemic cells in C57BL/6 mice (n=20 mice each time point). PB: periph- eral blood; BM: bone marrow. (B) Representative immunohisto- chemical analysis of tissue archi- tecture (top; hematoxylin and eosin, H&E) and of a progressive- ly hypoxic environment (bottom; carbonic anhydrase IX, CAIX) in spleen sections at different stages of disease progression compared to wild-type (WT) spleen. Magnification 20X, mag- nification of inset 40X. The graph on the right summarizes quantifi- cation of CAIX intensity (WT mice n=7; TCL1 early and late time- points n=13). Statistics were cal- culated with the Mann-Whitney test for unpaired data. (C) Confocal microscopy analysis of pimonidazole (PIM; red) accumu- lation in spleen sections at differ- ent stages of leukemia engraft- ment compared to WT spleen. B220 (green) and CD3 (white) mark B and T cells, respectively. Magnification 20X, insert 63X. (D) Left panel: representative plot of flow cytometry analysis of PIM accumulation in B cells collected from spleen. Right panel: cumula- tive graph of PIM staining on B cells from spleen, PB and BM samples of TCL1-injected mice (n=7) compared to not injected WT mice (n=7). Statistics were calculated with the Mann-
D
Whitney test for unpaired data.
haematologica | 2021; 106(5)
1345
