
Page 293 - 2021_04-Haematologica-web
P. 293
Letters to the Editor
formed by a single user and balanced sequencing runs). Distinct analyses performed per research center, age group and other clinical characteristics of the patients (such as HbF levels and presence or absence of splenecto- my, hepatomegaly, extramedullary hematopoiesis or bone deformities) were unable to detect any major differ- ences in the expression profiles. In order to further explore the data, we performed Principal Component
Analysis (PCA), which visualizes strong patterns in a dataset by reducing the dimensionality of the dataset and clustering of samples based on their similarity. PCA did not yield clear clustering when taken into account all the different patient characteristics, with the striking excep- tion of sex, where all samples were clustered into two distinct groups representing males and females irrespec- tive of the disease status (Figure 2A). Although a clear dis-
ADF
B
C
E
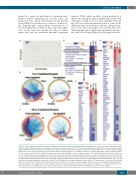
Figure 2. Differential gene expression analysis of β-thalassemia patients against healthy participants according to sex. (A) Principal Component Analysis (PCA) graph showing clustering of samples according to sex irrespective of disease status. (B-C) Circοs plots depicting the down-regulated (left) and up-regulated (right) significantly differentially expressed genes (DEG) when β-thalassemia intermedia (TI) (B) or β-thalassemia major (TM) (C) patients were analysed against healthy participants. Outer circle represents the type of analysis with red depicting analysis of all samples (sixteen TI or sixteen TM samples), green depicting analysis of male samples only (seven TI or eight TM samples) and blue depicting analysis of female samples only (nine TI or eight TM samples). Inner circle represents the overlap with dark orange depicting genes that exist in multiple lists and light orange depicting genes that are unique to that particular list. Purple lines link the same genes when shared by multiple lists, whereas blue lines link different genes that fall into the same ontology term. (D) Heatmap produced by Ingenuity Pathway Analysis (IPA) depicting enriched terms regarding canonical pathways when all TM patients were analyzed against healthy participants, male only TM patients were analyzed against healthy males or female only TM patients were analyzed against healthy females. The activation z-score depicts predicted inhi- bition or activation of the pathway. (E-F) Heatmaps produced by IPA for two example canonical pathways; glioma invasiveness signaling (E) and production of nitric oxide and reactive oxygen species in macrophages (F). The heatmaps depict gene expression levels (expression log ratio, i.e., log2fold change), whereas the boxes above the heatmaps depict the z-score corresponding to panel D and showing the predicted inhibition or activation of the pathway.
haematologica | 2021; 106(4)
1209
