
Page 292 - 2021_04-Haematologica-web
P. 292
1208
Letters to the Editor
AB
C
D
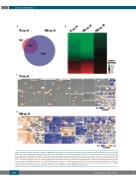
Figure 1. Differential gene expression analysis of β-thalassemia intermedia or β-thalassemia major patients against healthy participants. (A) Venn diagram
depicting common significantly differentially expressed genes (DEG) when β-thalassemia intermedia (TI) (n=16) or β-thalassemia major (TM) (n=16) patients were compared to healthy (H) participants (n=17). (B) Heatmap depicting relative normalized gene expression levels (z score) of all 2,999 genes that were found significantly differentially expressed in TI or TM patients when compared to healthy participants. The log2fold change values of the genes used range from -3.0 to 3.0. (C-D) Mosaic graphs produced by Ingenuity Pathway Analysis (IPA) depicting enriched terms regarding diseases and biological functions when TI patients were compared to healthy participants (C) or when TM patients were compared to healthy participants (D). The z score depicts predicted inhibition or activation of disease/function, whereas the size of the box represents the significance of each identified term (-log10 P-value). Due to visualization purposes, category labels are not shown in full, but detailed enrichment terms can be found in the Online Supplementary Table S7.
haematologica | 2021; 106(4)
