
Page 194 - 2021_04-Haematologica-web
P. 194
G. Juban et al.
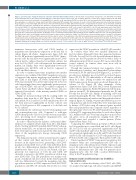
Figure 2. (previous page) Gata1s hemopoietic cells have abnormal differentiation kinetics. (A) Schematic of experiment. Hemopoietic cells (kithiCD41lo) from BirA, bioG1 and bioG1s day 6 (d6) embryoid bodies (EB) were cultured for another 6 days (up to day 12 [d12]). Aliquots of culture were analysed daily for kit and CD41 expression by fluorescence-activated cell sorting (FACS). In parallel, at d8, populations P1-P4 (see panel B-C) cells were purified by FACS-sorting, from cultures of three genotypes, re-cultured for 2 days and kit and CD41 analysed by FACS analysis. (B) Schematic of levels of kit and CD41 expression detected by flow cytometry. Neg: negative; lo: low and hi: high. Different levels of kit and CD41 expression define different hemopoietic cell populations in panels C-E. (C) Schematic summary of the data from panel (D), showing the two branches of hemopoietic differentiation undertaken by the initial kithiCD41lo (P1 population). P1 cells differentiate into P2 cells (kitloCD41lo). P2 cells then differentiate into either DN (double negative, kit–CD41–) cells or into P3 (kitloCD41hi) cells. P3 cells differentiate into P4 (kit–CD41hi) cells. (D) Representative FACS plots showing the differentiation of d6 hemopoietic cells (kithiCD41lo, termed P1 population) from BirA (top), bioG1 (middle) and bioG1s (bottom) cultures from d7 to d12 monitored by kit and CD41 expression. Numbers within gates are the mean percentage ± 1 standard deviation of cells within the gate from three independent experiments. (E) Example of the re-culturing of FACS-purified d8 populations for two additional days. Here, P3 cells were FACS-purified from BirA cultures (top), bioG1 (middle) and bioG1s (bottom) cultures and re-cultured for 2 days. Left, FACS plots of post-sort purity checks of sorted P3 cell popula- tion. Right, expression of kit and CD41 expression after two days of culture. (F) Quantitation of the different populations generated by FACS-sorted d8 P1, P2, P3 and P4 populations after an additional 2 days of culture (three independent experiments for BirA and bioG1, four independent experiments for bioG1s). (G) Principal com- ponent analysis (PCA) plot showing P1 to P4 populations (each dot corresponds to the average of the four replicates) from each genotype using all genes analysed by RNA sequencing. Percentage variance for each PC is shown. *P<0.05, **P<0.01 and ***P<0.001 vs. BirA. #P<0.05, ##P<0.01 and ###P<0.001 vs. bioG1.
immature hemopoietic cells) and CD41 (marker of megakaryocyte maturation) expression at d6 and d12 of culture (Figure 1E; Online Supplementary Figure S1F). D6 bioG1s EB produced significantly more kit+CD41+ (hemo- poietic) cells. By d12, there were significantly more CD41hi cells in bioG1s cultures than bioG1 and BirA cultures but most bioG1s CD41hi cells still expressed the immaturity marker, kit. Finally, there were significantly fewer non- megakaryocyte kit-CD41- cells in bioG1s compared to bioG1 and BirA cultures.
In order to further characterize megakaryocyte marker expression, we confirmed that CD41+ megakaryocytes also co-expressed the mature megakaryocyte markers CD42b and CD61 at d12 (Figure 1F; Online Supplementary Figure S1H), paradoxically even in kit expressing cells in bioG1s cells. Interestingly, there were significantly greater percent- age of CD41+CD61+ cells in bioG1s cultures compared to control bioG1 and BirA cultures. Finally, bioG1s cells also expressed lower levels of the maturity marker CD42b on CD41+CD61+ cells.
Finally, we measured cell growth by counting viable cell numbers daily from d6 to d12 (Figure 1G). Numbers of cells in BirA, bioG1 and bioG1s were similar from d6 to d9 but then increased significantly in bioG1s cultures and were 10-fold greater at d12 compared to both BirA and bioG1 cultures.
In summary, the cultures produced both megakaryocyte and non-megakaryocyte cells. Compared to wild-type GATA1 hemopoietic cells, bioG1s cells were more prolifer- ative, producing more immature megakaryocytes and fewer non-megakaryocytic cells.
In order to characterize the kinetics of abnormal differ- entiation we sampled cultures daily from d6 to d12 (Figure 2A-D). Starting with FACS-purified d6 kithiCD41lo cell pop- ulation (termed P1), we monitored maturation (lower the level of kit expression the more mature the cells) and acqui- sition of the megakaryocyte lineage (increasing CD41 expression).
The temporal sequence of flow cytometric plots suggest- ed that control cells (BirA and bioG1) first showed a decrease in kit expression level, generating a kitloCD41lo population (termed P2) (seen at d7). Cells in P2 then divid- ed into two differentiation branches (Figure 2B-D; Online Supplementary Figures S2A, S3A). In one branch, cells pro- gressively lost expression of both kit and CD41 (d8 onwards) to generate a kit–CD41– population (double neg- ative [DN] cells). This DN population was mainly com- posed of erythroid cells (see below). In the other branch, P2 cells also differentiated towards the megakaryocytic line- age with an increase in CD41 expression level (kitloCD41hi population, called P3) (d7 onwards) followed by loss of kit
expression (kit–CD41hi population, called P4) (d8 onwards). In contrast, there were two marked differences in bioG1s cultures (Figure 2D). First, they generated far fewer DN cells. Second, bioG1s cells showed enhanced differen- tiation into the P3 population (d9-10) but with a delay of differentiation into P4 (best seen at d8-9, more cells in P4 in control cultures). In contrast, there were more cells in
bioG1s in P4 at d12.
Though this temporal analysis was suggestive of two
differentiation branches and hierarchical relationships between P2, P3, P4 and P2 and DN (Figure 2C), in order to provide more definitive proof we FACS-sorted each popu- lation (P1, P2, P3, P4) individually at d8 and re-cultured them for 2 days. During re-culture we analyzed kit and CD41 expression in the progeny produced (Figure 2E, re- culture of P3, Figure 2F, data summary; Online Supplementary Figures S2B, S3B). FACS-sorted P1 generated all the other populations. Purified P2 generated all the pop- ulations except P1. P3 differentiated primarily into P3 and P4 only but not DN cells. Finally, re-culturing of P4 cells generated principally P4 cells. These data were consistent with the differentiation branches and hierarchical relation- ships in Figure 2C. Finally, we performed RNAseq on sort- ed populations and showed that they were transcriptional- ly distinct. A PCA plot using all expressed genes revealed that each population form a separate cluster, regardless of their genotype. Moreover P3 and P4 populations segregat- ed along PC1, suggesting they related to each other (Figure 2G). Analyses have also been run using the top most vari- ant genes across all populations, ranging from 100 to 10,000 genes and revealed a similar pattern (Online Supplementary Figure S3C).
Comparing the differentiation potential of FACS-sorted bioG1s populations to control BirA and bioG1 cells (Figure 2F), bioG1s P1 cells also generated significantly more P2 and P3 cells than BirA and bioG1 P1 cells. BioG1s P2 cells also generated significantly more P2 and P3 cells than BirA and bioG1 P2 cells. Finally, bioG1s P3 cells generated more P3 but fewer P4 cells compared to BirA and bioG1 P3 cells.
Taken together, kithiCD41lo hemopoietic progenitors dif- ferentiate either into non-megakaryocytic DN cells or megakaryocytic cells with increased CD41 expression and loss of kit expression. BioG1s mutant cells have a reduced ability to differentiate into DN cells but generate more megakaryocytic cells but with a partial differentiation delay at the P3 population stage.
Reduced erythroid differentiation by bioGATA1s hemopoietic cells
In order to confirm the identity of kit–CD41– cells (DN), we analyzed morphology, cell surface markers and mRNA
1110
haematologica | 2021; 106(4)
