
Page 192 - 2021_04-Haematologica-web
P. 192
G. Juban et al.
G
AB
CE
D
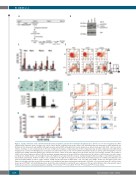
Figure 1. Gata1s embryonic stem cell-derived hematopoietic progenitors generate more immature megakaryocytes. (A) Protocol of in vitro megakaryocyte differ- entiation from embryonic stem cells (ESC). Top, day of culture. Below, sequential steps in the culture. TPO: thrombopoietin; IL6: interleukin 6; IL11: interleukin 11. (B) Western blot probed with anti-mGATA1 antibody (top panel) and anti-TBP antibody (bottom panel) using nuclear extracts from day 6 (d6) CD41+ cells from in vitro cultures. Genotype of cells is indicated above the blot. (C) Expression analysis of indicated genes in three independent day 12 (d12) embryoid bodies (EB)-derived megakaryocyte cultures from BirA (grey bar), bioG1 (blue bar) and bioG1s (red bar) cells or from undifferentiated ESC (black bar). (D) Top, photomicrographs of acetyl- cholinesterase (AChE) stained megakaryocytes (arrows) from d12 of culture. Scale bars indicate 100 mm. Below, bar plot of percentages of AChE+ cells (relative to CD41hi cells) in three different cultures. (E) Flow cytometry showing expression of kit and CD41 on cells produced at d6 (above) or d12 (below) of in vitro culture. Left, BirA cells, middle, bioG1 cells and right, bioG1s cells. Figures in each gate show the mean ±1 standard deviation (SD) percentage of cells within the gate (five independent experiments). Position of CD41hi cells is indicated on the right of the d12 plot. (F) Flow cytometry showing expression of CD42b and CD41 (top) and CD61 and CD41 (middle) at d12 of culture. Bottom, CD42b and kit expression in CD41+CD61+ cells. Left, BirA cells, middle, bioG1 cells and right, bioG1s cells. Figures in each gate show the mean ±1SD percentage of cells within the gate (three independent experiments). (G) Viable cell count (y-axis) from d6 to d12 in culture (x-axis) when kithiCD41+ cells from BirA (grey line), bioG1 (blue line) and bioG1s (red line) EB were replated on OP9 layer with cytokines (three independent experi- ments). Dead cells were excluded by trypan blue staining. *P<0.05 and **P<0.01 vs. BirA. #P<0.05, ##P<0.01 and ###P<0.001 vs. bioG1.
1108
haematologica | 2021; 106(4)
F
