
Page 51 - 2021_03-Haematologica-web
P. 51
Aberrant expression of SCF in CLL
vironment, we first analyzed the expression profile of c- kit, the receptor for SCF. Immunohistochemical analysis of c-kit expression in CLL biopsies disclosed immunopos- itivity in tryptase-positive mast cells that were invading the lymph nodes and, mainly, the bone marrow of CLL patients in large numbers, in keeping with the literature (Online Supplementary Figure S7A and B).40 CLL cells were negative for typical surface c-kit expression. However, in some cases, a few neoplastic lymphoid cells exhibited weak c-kit nuclear immunopositivity (Figure 5A). A simi-
lar pattern emerged in RQ-PCR studies in negatively selected CLL cells in which KIT transcripts were detected at low abundance, albeit at significantly higher (FD:3.26; P=0.0039) levels in SCFlow cases (n=7) than in SCFhigh cases (n=8) (Figure 5B, Online Supplementary Figure S7C). It is also relevant to mention that KIT transcripts were detect- ed in our previous transcriptome analysis of adverse prog- nosis CLL (more particularly, stereotyped subsets #6 and #8),41 hence strengthening the present observations.
Next we stimulated CLL cells with soluble SCF and
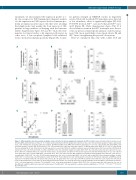
ABC
DEF
GHI
Figure 3. Mitochondrial redox homeostasis modulates stem cell factor in chronic lymphocytic leukemia. (A) Mitochondrial mass (determined by mean fluorescent intensity, MFI) and membrane potential (% +) of CpG-treated IG-unmutated chronic lymphocytic leukemia (U-CLL) cells: flow cytometry analysis of viable, CpG-treated U-CLL cells normalized to respective untreated controls. (B) Mitochondrial mass (MFI) and membrane potential (% +) of U-CLL cells treated with CpG/CD40L: flow cytometry analysis of viable CpG/CD40L-treated U-CLL cells normalized to respective untreated controls. (C) Mitochondrial mass (MFI) of CLL cells co-cultured with the mesenchymal HS-5 cells. Interconnected dots represent one case in two different conditions and bars represent median values. (D) Stem cell factor (SCF) protein expression in CLL cells from short-term co-cultures with HS-5 cells: flow cytometry analysis for viable CD19+/SCF+ CLL cells. Interconnected dots represent one case in two different conditions while bars represent median values. (E) Spearman correlation of SCF protein expression and mitochondrial mass in CLL cells cultured alone (gray dots) and co-cultured with HS-5 cells (black dots). The x axis represents the MFI of MitoGreen probing for mitochondrial mass while the y axis the per- centage viable CD19+/SCF+ CLL cells. (F) SCF protein expression in CLL cells co-cultured with HS-5 cells ± H2O2 and ± CpG/CD40: flow cytometry analysis of viable CD19+/SCF+ co-cultured CLL cells normalized to viable CD19+/SCF+ monocultured CLL cells. (G) Spearman correlation of SCF protein expression and HIF-1α protein expression in healthy tonsillar B cells (black dots) and CLL B cells (gray dots). The x axis represents HIF-1a protein levels while the y axis represents SCF protein levels, both normalized to β-actin; data are derived from western blot studies. (H, I) Protein expression of hypoxia-inducible factor-1α (HIF-1a) (H) and SCF (I) in SCFhigh U-CLL cells from long-term co-cultures (72 h) with HS-5 cells: flow cytometry analysis for viable CD19+/SCF+ CLL cells. Interconnected dots represent one case in two different conditions while bars represent median values. The Wilcoxon P test was applied to evaluate statistical significance. *P<0.05, **P<0.01, ***P<0.001. FD: fold difference.
haematologica | 2021; 106(3)
697
