
Page 40 - 2021_03-Haematologica-web
P. 40
L.-A. Sutton et al.
assessed variant calling at the individual assay level i.e., pairwise analysis of variants detected amongst centers uti- lizing the same assay. We initially limited this analysis to the nine genes analyzed by all techniques (NFKBIE and EGR2 are discussed separately below). After filtering for variants present in the 1,000 genomes project, the paired normal sample and synonymous variants, and removal of PCR/sequencing artefacts, variants with a VAF >0.5% were compared. Application of a strict VAF cut-off at this stage of the analysis could be misleading as variants bor- derline of the threshold would not be taken into consider- ation and be deemed as discordant. Instead, concordance was defined as the ability to detect a variant irrespective of the VAF, while accuracy was defined as the degree of agreement between the VAF detected by the same panel. In order to aid in this analysis, variants were assigned to 1 of 5 groups: group 1, variant detected in both centers with a VAF >5%; group 2, variant was detected in one center with a VAF >5% and in the partner center with a VAF
<5%; group 3, variant was detected in both centers with a VAF <5%; group 4, variant was detected in only one of the partner centers and with a VAF >5%; and, group 5, variant was detected in only one of the partner centers and with a VAF <5%.
Looking first at the mutational data generated by the Multiplicom assay, a total of 133 variants passed the qual- ity filters and these could be grouped as follows: group 1 (n=104), group 2 (n=8), group 3 (n=16), group 4 (n=1) and group 5 (n=4) (Figure 2; Online Supplementary Table S8). Hence, variant calling between the two centers utilizing the Multiplicom assay reached a concordance of 128 of 133 (96.2%) with five variants detected by only one center (4 of these 5 variants had a VAF <5%; the remaining vari- ant had a VAF of 22.8%) (Figure 2; Online Supplementary Table S8-10). This latter higher frequency variant con- cerned a p.L265P substitution within MYD88 and likely constitutes a false-positive stemming from the wet-lab sample handling (further detailed in the Online
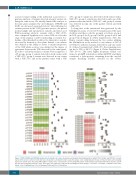
Figure 3. TP53, SF3B1, and NOTCH1 variants detected by the six centers. Heatmaps and boxplots illustrating mutations within TP53, SF3B1, and NOTCH1. Columns represent the six test centers (C1-C6) and rows correspond to a mutation found in a specific sample. Color coding indicates the type of mutation whereas the shading depicts the variant allele frequency (VAF) (lighter to darker tones correspond to an increasing VAF). Boxes marked with a hash symbol (#) indicate that the variant was not detected by that particular center. TP53 splice site mutations resulted in the following nucleotide changes: c.96+1G>T, c.673-2A>T, c.783-2A>C and c.920- 2A>G). C1 & C2 (Multiplicom), C3 & C4 (Illumina TSCA) and C5 & C6 (HaloPlex).
686
haematologica | 2021; 106(3)
