
Page 38 - 2021_03-Haematologica-web
P. 38
L.-A. Sutton et al.
Next-generation sequencing and data analysis
Cluster generation and paired-end sequencing was performed on the MiSeq instrument (Illumina, San Diego, CA). All sequenc- ing data were centrally analyzed using a custom bioinformatics pipeline. Illumina sequencing adapters were removed using TrimGalore v.0.6.0 and trimmed reads were aligned to the human reference genome hg19/NCBI GRCh37 using BWA mem v.0.7.12 with standard parameters. Variants were identified using VarScan2 v.2.3.7 in mpileup2cns mode with a minimum average quality of 30 and annotated with SnpEff and SnpSift. Bioinformatic analyses of the NGS dataset containing UMI was performed as follows: SurecallTrimmer v4.0.1 (Agilent Technologies, Santa Clara, CA, USA) was used to remove adaptor sequences, mask HaloPlex enzyme footprints and trim low-quali- ty bases. Processed reads were aligned to the hg19 human refer- ence genome with BWA v.0.7.12 and duplicate reads were marked using the Agilent LocatIt tool (v4.0.1). Variants were called with Pisces v.5.2.7.47 using a VAF cut-off of 0.5% and annotated with SnpEff and SnpSift. Variants had to meet the following conditions to be included in downstream analyses: (i) located within an exon- ic or splicing region; (ii) be non-synonymous; and (iii) not listed in the European 1,000 genomes variant database.
Results
Gene Panel Coverage
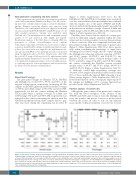
The gene panel designs for Illumina TSCA, HaloPlex and Multiplicom covered 100%, 99.9% and 100% of the targeted coding regions, respectively. Sequencing 48 CLL samples on the MiSeq platform yielded a median coverage of 3,834x and 1,540x (range: 2,991-7,761 and 161-3,068, respectively) for the two centers utilizing the Illumina TSCA panel while a median coverage of 1,062x and 1,953x (range: 334-2,427 and 338-7,496, respectively) was achieved in the centers performing the analysis with the HaloPlex enrichment system (three samples failed to gen- erate any reads during the sequencing run in center 5)
(Figure 1; Online Supplementary Table S2-3). For the Multiplicom CLL MASTR kit, 24 samples were sequenced over two runs and this reduction in samples/run combined with the smaller size of the panel (NFKBIE and EGR2 were not included in this predesigned panel) was reflected in the increase in median coverage obtained; 5,469x and 3,426x (range: 1,432-13,589 and 2,244-4,194, respectively) (Figure 1; Online Supplementary Table S4).
Variability was observed in the depth of coverage gen- erated for individual samples analyzed within the same center and also between centers, however the percentage of bases covered at 100x was comparable between sam- ples prepared using the same technology at partner sites (Figure 1; Online Supplementary Table S2-4). More specifi- cally, when considering the percentage of target bases obtaining at least 100x coverage, the two centers utilizing the Multiplicom technology achieved a median of 99.8% and 99.6% (range: 99.4-99.8% and 99.5-99.7%), the Illumina TSCA test centers obtained median values of 99.7% and 96.5% (range, 99.6-100% and 70.5-98%) while the centers evaluating the HaloPlex system recorded median values of 94.2% and 97.6% (range: 64.8-97.2% and 90.2-99.4%) (Figure 1; Online Supplementary Table S2- 4). Although overall high sequencing coverage was obtained, a few samples in individual centers had less than 90% of bases within the targeted ROI achieving at least 100x coverage (Figure 1, Online Supplementary Table S2-5). Detailed information on the coverage per target region for the samples not fulfilling a 90% coverage threshold are provided in the Online Supplemental Table S6-7.
Pairwise analysis of variant calls
Although the gene content of the panels was compara- ble, with the noted exception of the absence of the NFKBIE and EGR2 gene hotspots from the Multiplicom assay, the number and precise location of probes varied between the assays. In order to rule out any inherent assay-specific technical variability or probe bias we first
Figure 1. Gene panel coverage. Boxplots illustrating the coverage obtained for all samples and the percent of bases covered at 100x across all six test centers. As illustrated, high coverage was obtained for the majority of samples across all centers, however a few samples had less than 90% of bases within the targeted regions of interest (ROI) obtaining >100x coverage. Notably, the partner center utilizing the same technology obtained high coverage for these particular samples across all ROI indicating that the low coverage arose from a local issue rather than an inherent technological or design issue. For the Multiplicom CLL MASTR kit, 24 samples were sequenced over two runs and this reduction in samples/run combined with the smaller size of the panel was reflected in the increase in median coverage obtained compared to the other assays whereby all 48 samples were sequenced in a single run. C1-C6 represent the six participating centers: C1 & C2 (Multiplicom), C3 & C4 (Illumina TSCA) and C5 & C6 (HaloPlex).
684
haematologica | 2021; 106(3)
